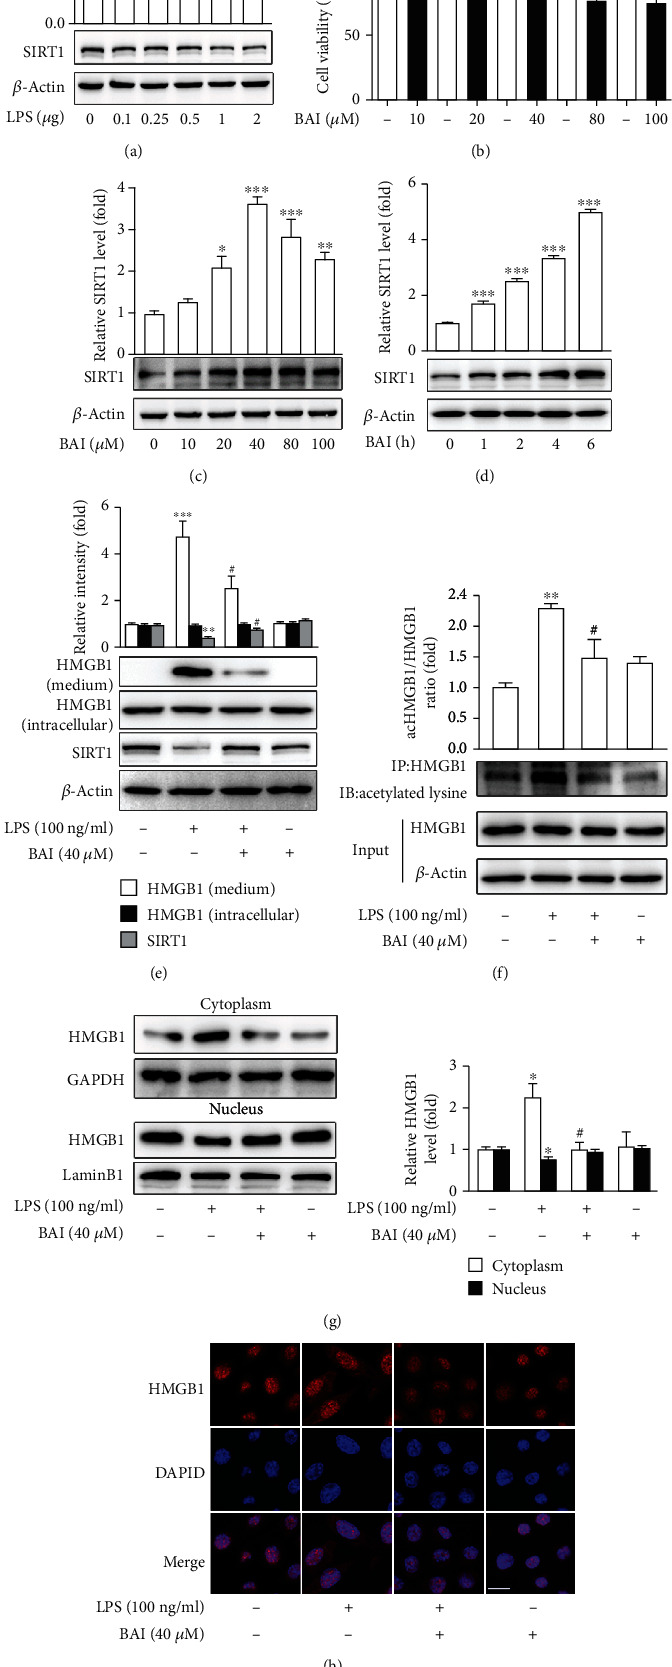
Figure 4.

BAI significantly increased SIRT1 expression and decreased HMGB1 release in LPS-induced BV2 microglia. (a) BV2 cells were stimulated with various concentrations of LPS (0.1, 0.25, 0.5, 1, and 2 μg/ml) for 24 h, followed by western blot analysis of SIRT1 protein. (b) BV2 cells were cultured with the indicated BAI concentrations (10, 20, 40, 80, and 100 μM) for 24 h, and cell viability was determined by CCK8. (c, d) BV2 cells were cultured with different BAI concentrations for 24 h (c) or with 40 μM BAI for different durations (1, 2, 4, and 6 h) (d), and SIRT1 levels were analyzed by immunoblotting. (e) BV2 cells were pretreated with 40 μM BAI for 2 h, followed by 100 ng/ml LPS stimulation for 24 h. Western blot analysis of the levels of SIRT1, secreted HMGB1, and intracellular HMGB1 was performed. (f) BV2 cells were preincubated with 40 μM BAI for 2 h and then stimulated with 100 ng/ml LPS for 4 h. Acetylated lysine and HMGB1 expression levels were determined by immunoprecipitation. (g) BV2 cells were pretreated with 40 μM BAI for 2 h, followed by 100 ng/ml LPS treatment for 6 h. The nucleocytoplasmic translocation of HMGB1 was determined by western blot analysis. GAPDH and LaminB1 were used as loading controls for the cytoplasmic and nuclear fractions, respectively. (h) Immunofluorescence of the HMGB1 (red) cytosolic translocation was conducted with confocal scanning microscopy. Scale bar = 10 μM. All data were normalized to the control group and are presented as means ± SEM (n = 3). ∗P < 0.05, ∗∗P < 0.01, ∗∗∗P < 0.001, control vs. LPS; #P < 0.05, BAI+LPS vs. LPS.
