Figure 3.

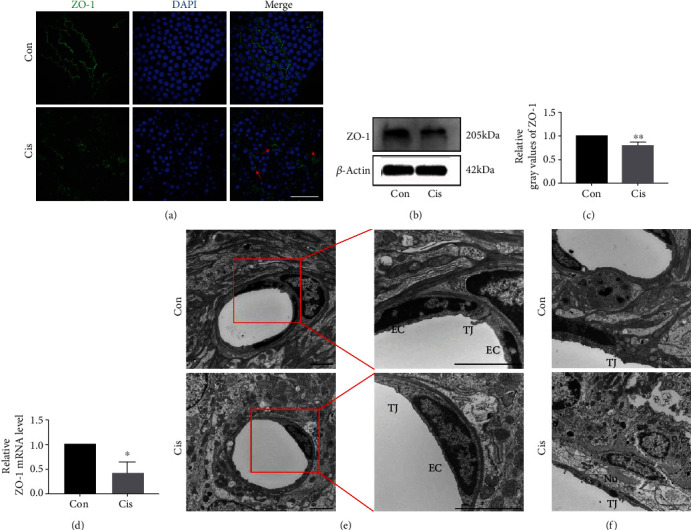
Cisplatin alters the expression pattern and decreases the expression of ZO-1 in SV. (a) The distribution of ZO-1 (green) in MCs by immunofluorescence staining. The moderate-to-strong ZO-1 signal is visible as a continuous wavy line between adjacent MCs in control mice, while the weak-to-moderate ZO-1 signal is seen mainly in the cell cytoplasm in cisplatin-treated mice. Asterisks show holes formed between marginal cells. Arrows point to morphological alterations in intercellular junctions. Nuclei were stained with DAPI (blue). Scale bars, 100 μm. (b) Western blot analysis of the cell lysates of SV treated with cisplatin. β-Actin was used as a loading control. (c) Densitometric quantification of the mean (SD) ratio of ZO-1 expressed as mean ± SD (n = 3). (d) qRT-PCR shows mRNA for ZO-1 in the SV (n = 3). (e) The ultrastructure of SV was analyzed by TEM. TJs between adjacent ECs were extremely tight in control mice; the right window (zoomed inset) displays a higher magnification of the TJs between ECs; TJs were open and intermittently widened between adjacent ECs in cisplatin-treated mice. Scale bars, 2 μm. (f) TJs between adjacent MCs were extremely tight in the control mice; TJs were open between adjacent MCs in cisplatin-treated mice. Scale bars, 2 μm. Con: 0.9% physiological saline; Cis: cisplatin; TJ: tight junction; EC: endothelial cell; m: mitochondrion; Nu: marginal cell nucleus. ∗p < 0.05, ∗∗p < 0.01, and ∗∗∗p < 0.001.
