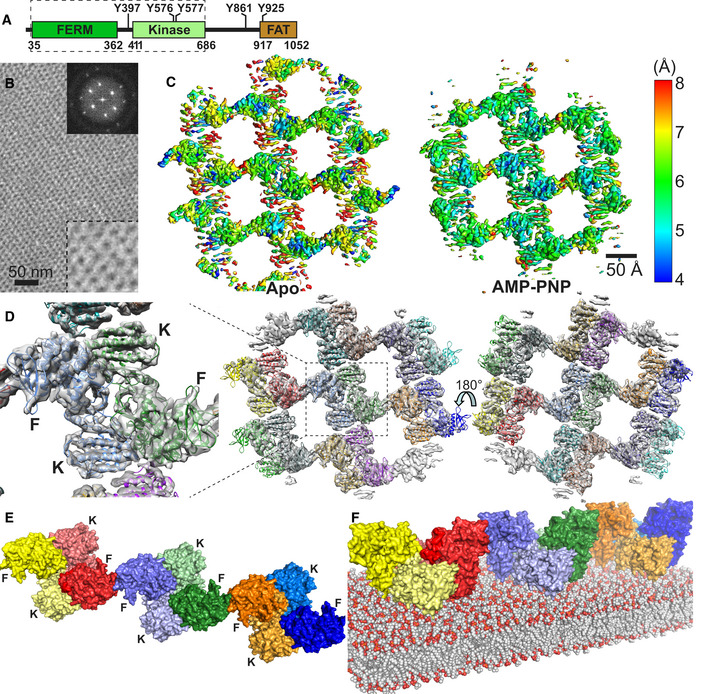
Figure 1. Cryo‐EM structure of the FERM‐kinase region of FAK on a PI(4,5)P2 membrane.

- Domain structure of FAK. Important phosphorylation sites are indicated, and the FAK region used in the cryo‐EM study is boxed with a dashed line.
- Negative stain image of 2D crystals containing the FERM‐kinase region of FAK bound to a PI(4,5)P2 monolayer. Top right insert: Fourier transform of the 2D crystal image. Bottom right insert: 2.5× zoom of the main image.
- Local resolution map of the refined Apo and AMP‐PNP particle, as calculated with Blocres.
- 14 FAK molecules, each containing a FERM and kinase domain, are fitted into the EM maps obtained from the AMP‐PNP dataset. Each molecule is in a different color. Middle: Membrane distal view; right: Membrane proximal view; left: zoomed view of central symmetric dimer from the membrane distal view with locations of FERM (F) and kinase (K) domains indicated. The equivalent figure for the Apo structure is shown in Fig EV1D.
- Linear oligomeric assembly of FAK formed by three symmetric FAK dimers in the AMP‐PNP particle shown from the membrane distal view. FERM (F) and Kinase (K) domains are labeled. FERM and kinase of the same molecule are in the same color with the kinases shaded in a lighter tone.
