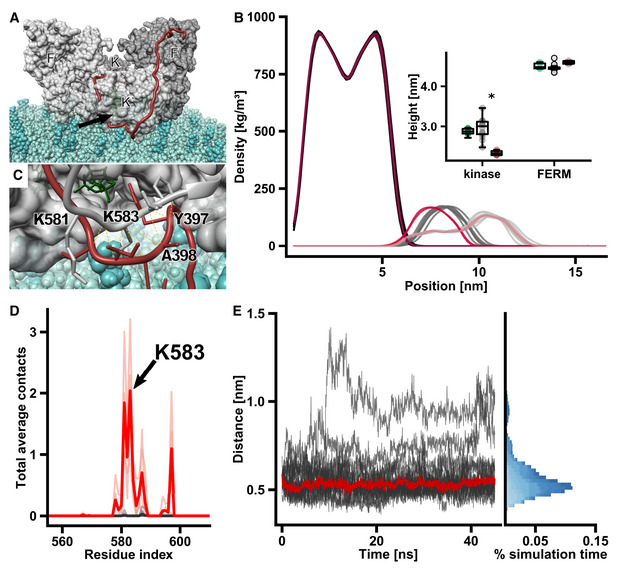
FAK dimer with Y397 bound to the active site on a lipid bilayer. Monomers are shown in different shades of gray and FERM (F, F’) and kinase (K, K’) domains are labeled. The FERM‐kinase linker (red) makes a sharp turn at the active site cleft (arrow) due to the constraints from the lipid membrane. Note that we here show one of many putative positions of linker residues in between the active site and the domains, as the linker is likely very flexible.
Mass density along the direction vertical to the membrane plane. From left to right, the densities of the lipid bilayer (darkest colors), kinase domains (medium shade colors), and FERM domains (lightest colors) are shown. Data from models with the Y397 substrate bound to the active site (n = 14) are depicted in gray, unbound active site models (n = 4) are in red. Insert: The heights are defined as the perpendicular distance between the center of mass (COM) of the domains and the phosphodiester bonds connecting lipid head groups and tails within a 1 nm radius from the respective COM. Shown are heights of starting models (bound + unbound, green), substrate bound simulations (gray), and unbound simulations (red). The central band of the boxplot represents the median and boxes the 25% (Q1) and 75% (Q3) quartiles. Lower and upper whiskers are defined as the lowest value above Q1–1.5*(Q3‐Q1), and the highest value below Q3 + 1.5*(Q3 − Q1), respectively. *P < 0.01, determined by an independent two‐sample t‐test.
Residues from the activation loop (gray) interact with FERM‐kinase linker residues (red) adjacent to Y397, which is bound to the kinase active site. ATP is shown in green.
Plot of membrane contacts. In FAK dimer simulations, in which Y397 is not bound to the active site, residues from the activation loop interact with lipid head groups (red lines). These contacts are not present in simulations, in which Y397 is bound to the active site (gray lines). Darker traces show mean number of contacts, and light traces show contacts from individual simulations.
FERM‐kinase linker residues form stable interactions with activation loop residues during the course of the simulation. The distance between the backbone Cα of I400 in the linker and K583 in the activation loop is shown, with the red line representing the median distance. Different shades of blue in the histogram represent distinct simulations.

