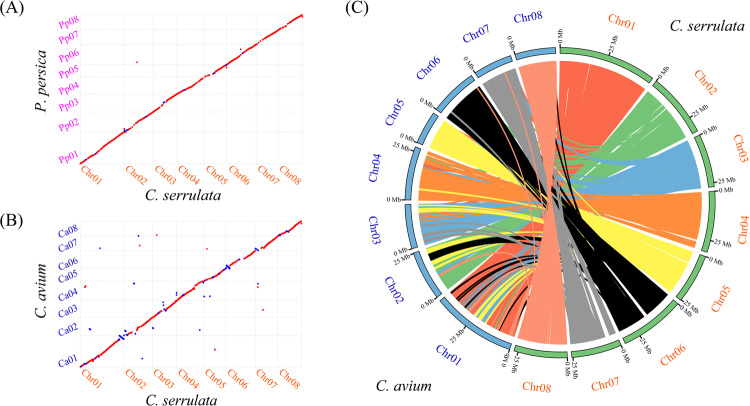
Fig. 3. Synteny analysis via comparisons of Cerasus serrulata with Prunus persica and Cerasus avium.
a Colinear map of the C. serrulata genome and P. persica genome. The red color represents identical sequences in the same orientation, while the blue color represents identical sequences in the opposite orientation. b Colinear map of the C. serrulata genome and C. avium genome. The red color represents identical sequences in the same orientation, while the blue color represents identical sequences in the opposite orientation. c Syntenic blocks of C. serrulata and C. avium

