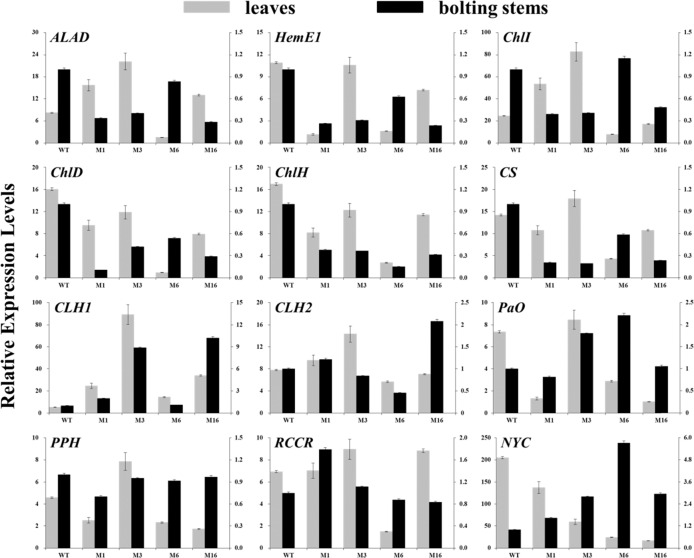
Fig. 5. Expression levels of genes related to chlorophyll biosynthesis and degradation.
The leaves and bolting stems of mutants and WT plants were sampled 6 weeks after transplanting. The main axis represents the amount of gene expression in the leaves, and the secondary axis represents the amount of gene expression in the bolting stems. WT wild-type plant, M1 biallelic mutant, M3 M6, M16 homozygous mutants. ALAD 5-aminolevulinic acid dehydratase, HemE1 glutamyl tRNA reductase, ChlI magnesium-chelatase I, ChlD magnesium-chelatase D, ChlH magnesium-chelatase H, CS chlorophyll synthase, CLH chlorophyllase, PaO pheide a oxygenase, PPH pheophytinase, RCCR red Chl catabolite reductase, NYC nonyellow coloring

