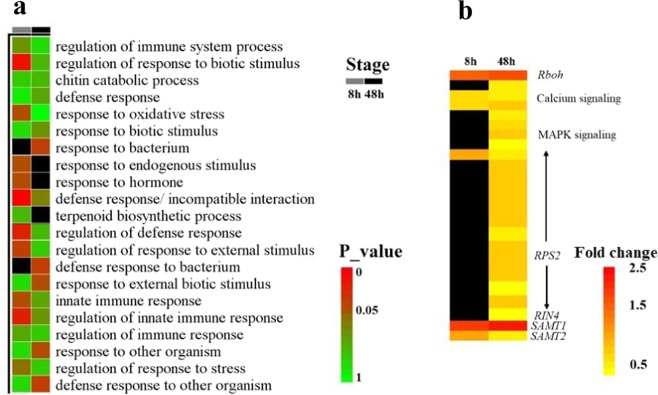
Fig. 2. Analysis of DEGs related to disease resistance.
a Heat map of Gene Ontology terms related to disease resistance as identified for upregulated genes. The red cubes indicate high enrichment factors for the corresponding gene functions, and the black cubes indicate that the corresponding gene functions are not enriched. b Heat map of the genes related to disease responses. Red represents a high fold change, and black represents genes that are not differentially expressed

