Figure 1.
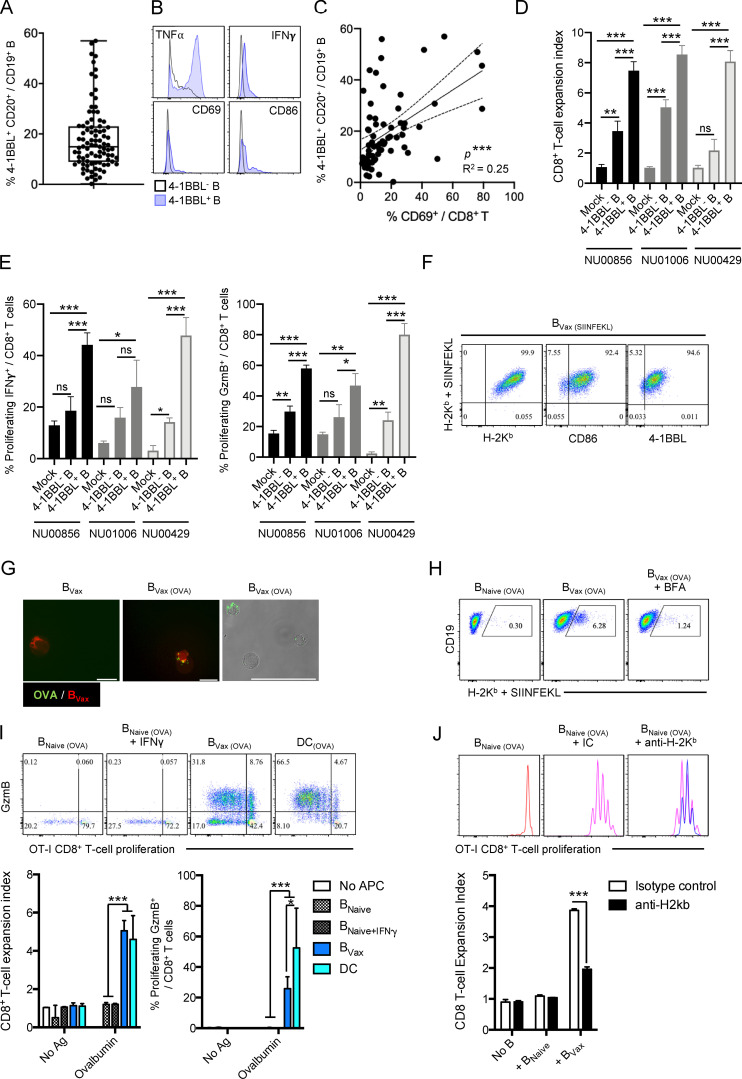
4-1BBL+ B cells in GBM patients’ peripheral blood and Ag-presenting function. (A) Box plot showing the expression of 4-1BBL in CD20+CD19+ B cells from newly diagnosed GBM patients’ PBMCs (n = 90). Box plots express the following values: median (line inside the box), 75th and 25th percentiles (box extremities), and maximum and minimum values (dashes). (B) Histograms representing the intracellular expression of TNFα and IFNγ and surface expression of CD69 and CD86 by 4-1BBL− (black line) and 4-1BBL+ (blue line) B cells. (C) Linear regression analysis of 4-1BBL expression by B cells and CD69 expression by CD8+ T cells in newly diagnosed GBM patients’ PBMCs (n = 68). (D and E) CD8+ T cell costimulation assay using CD8+ T cells activated with anti-CD3 and IL-2 mixed with autologous 4-1BBL− and 4-1BBL+ B cells from peripheral blood of three newly diagnosed GBM patients (NU00856, NU01006, and NU00429). CD8+ T cell activation was measured as cellular expansion (D) and expression of intracellular IFNγ and GzmB (E). The experiment was performed in triplicate. (F) BVax from GL261-OVA mice were pulsed with SIINFEKL (BVax(SIINFEKL)) and evaluated for SIINFEKL presentation by MHC class I (H-2Kb + SIINFEKL Ab) and the coexpression of MHC class I (H-2Kb) and costimulatory molecules CD86 and 4-1BBL. A representative experiment of three independent experiments is shown. (G and H) BVax were tested for their ability to uptake Alexa Fluor 488–conjugated OVA (BVax[OVA]; G) and present SIINFEKL peptide via MHC class I (H-2Kb; H). Surface transport of the H-2Kb + SIINFEKL complex was inhibited using brefeldin A (BFA). A representative experiment of three independent experiments is shown. Scale bars represent 15 µm (fluorescence images) and 50 µm (fluorescence and bright light image). (I) BNaive, BNaive + IFNγ, BVax, and DCs were pulsed with OVA and tested for their ability to promote OT-I CD8+ T cell activation assessed by cell proliferation (expansion index, x axis) and intracellular expression of GzmB (y axis). The experiment was performed in triplicate. A representative experiment of two independent experiments is shown. (J) OT-I CD8+ T cells cultured with BNaive; BVax pulsed with OVA and isotype control, BVax(OVA) + IC; or MHC class I blocking Ab, BVax(OVA) + anti-H2Kb, and tested for their cellular expansion. A representative experiment of two independent experiments is shown. Differences among multiple groups were evaluated using one-way ANOVA with post hoc Tukey's multiple comparisons test. Statistical significance is depicted as follows: *, P < 0.05; **, P < 0.01; ***, P < 0.001. ns, not statistically significant.

