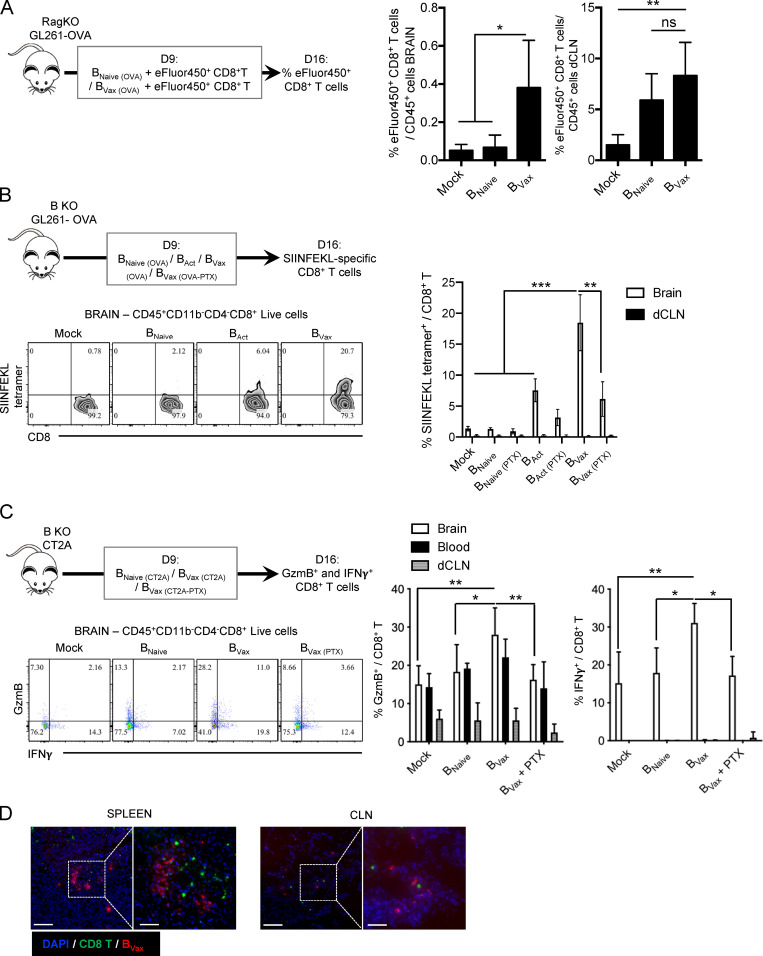
Figure 2.
BVax APC function in vivo. (A) Rag1-deficient mice were challenged intracranially with GL261-OVA. 9 d after, mice received i.v. BNaive or BVax pulsed with OVA protein. eFluor450-labeled CD8+ T cells from WT C57BL/6 mice were concomitantly injected with B cells (n = 4 mice/group). 7 d after the cell adoptive transfer, eFluor450+ CD8+ T cells were evaluated by flow cytometry in the tumor-bearing brains and the dCLNs. A representative experiment of two independent experiments is shown. (B) B KO mice were challenged intracranially with GL261-OVA. 9 d after, mice received i.v. BNaive, 4-1BBL− B cells activated with CD40 agonism and IFNγ (BAct) or BVax pulsed with OVA protein. A group of BVax(OVA) mice was pretreated with PTX before injection (n = 4 mice/group). 7 d after the cell adoptive transfer, SIINFEKL-specific CD8+ T cells were analyzed in the tumor-bearing brains by flow cytometry using SIINFEKL-tetramer. A representative experiment of two independent experiments is shown. (C) B KO mice were challenged intracranially with CT2A cells. 9 d after, mice received i.v. BNaive and BVax pulsed with CT2A tumor lysates pretreated with or without PTX (n = 5 mice/group). 7 d after the cell adoptive transfer, CD8+ T cells were evaluated for the intracellular expression of GzmB and IFNγ in the tumor-bearing brain, blood, and dCLNs. A representative experiment of three independent experiments is shown. (D) Rag1-deficient (KO) mice were challenged intracranially with CT2A cells. 9 d after, mice i.v. and concomitantly received both CellTracker red CMPTX BVax (red) cells and CellTracker green CMFDA-labeled CD8+ T cells (green). BVax and CD8+ T cell splenic localization was analyzed by fluorescent microscopy. Scale bars represent 100 µm (left image, 20× magnification) and 50 µm (right image, 63× magnification). Images are representative of the spleen and CLN of three mice. For all experiments shown in this figure, differences among multiple groups were evaluated using one-way ANOVA with post hoc Tukey's multiple comparisons test. Histograms are shown as mean ± SD. Statistical significance is depicted as follows: *, P < 0.05; **, P < 0.01; ***, P < 0.001. ns, not statistically significant.

