Figure 3.
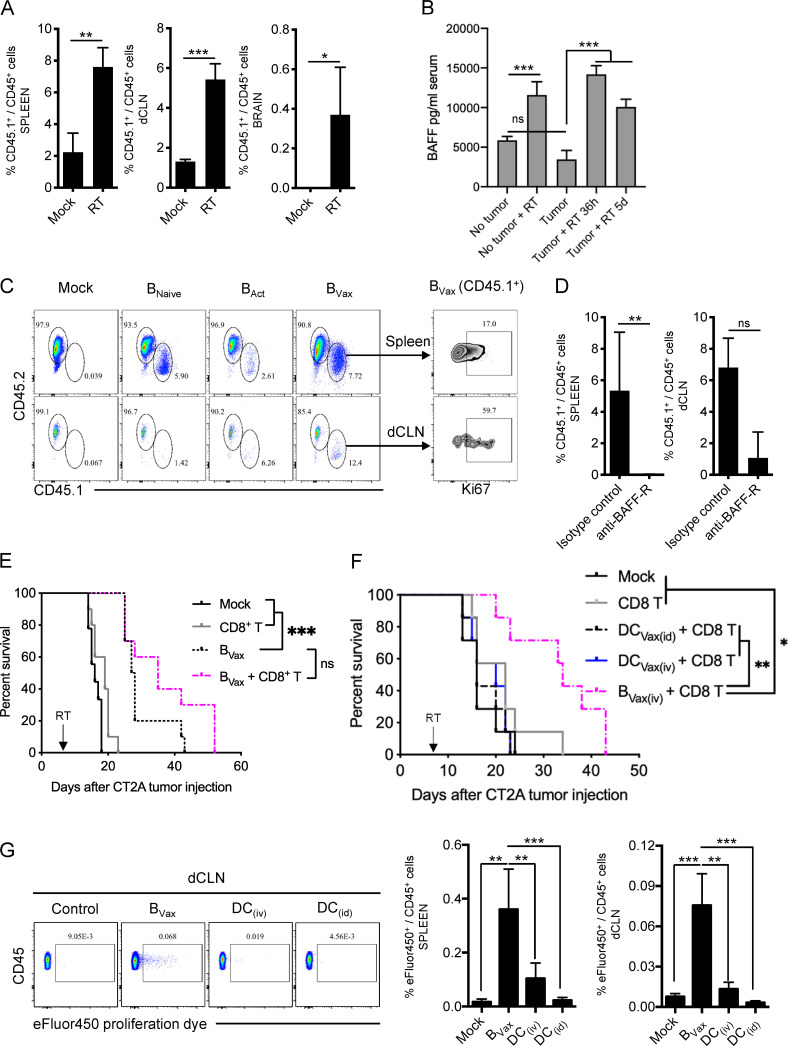
Radiotherapy favors B cell adaption in vivo. (A) CT2A-bearing mice were irradiated (RT), and CD45.1+ BVax were adoptively transferred i.v. CD45.1+ cells were analyzed by flow cytometry in the spleens, dCLNs, and tumor-bearing brains (n = 4 mice/group). (B) Irradiated CT2A-bearing mice were bled 36 h and 5 d after RTx (n = 3 mice/group). Serum BAFF levels were analyzed and compared with nonirradiated (Tumor) and non–tumor-bearing mice serum (No tumor). (C) The same experiment as in A was performed using CD45.1+ BNaive, BAct (4-1BBL− B cells activated with anti-CD40 and IFNγ), or BVax. CD45.1+ cells were analyzed by flow cytometry in the spleen and dCLN. B cell proliferative status was assessed by the expression of Ki67. A representative animal for each group (n = 3 or 4 mice/group) is depicted. The experiment was repeated twice independently. (D) Alternatively, a group of mice received B cells pretreated with BAFF-R–blocking Ab. The treatment was also administered to the mice i.v. for 3 consecutive d after B cell transfer. (E) Irradiated CT2A-bearing mice received i.v. vehicle (Mock, black line), CD8+ T cells (gray line), pulsed BVax (black dashed line), or combined pulsed BVax + CD8+ T cells (pink dotted line). The experiment was performed using n = 10 mice/group. A representative experiment of three independent experiments is shown. (F) Irradiated CT2A-bearing mice received i.v. vehicle (Mock, black line), CD8+ T cells (gray line), CD8+ T cells i.v. + pulsed DCVax administered either i.d. (DCVax(i.d.); dashed black line) or i.v. (DCVax(i.v.); blue line), or pulsed BVax + CD8+ T cells (pink dotted line). The experiment was performed using n = 10 mice/group. A representative experiment of two independent experiments is shown. (G) Irradiated CT2A-bearing mice received i.v. eFluor450-labeled BVax or DCs. DCs were administered either i.v. (DC(i.v.)) or i.d. (DC(i.d.)). 7 d after cell transfer, eFluor450+ cells were analyzed in the dCLN and spleen (n = 3 or 4 mice/group). A representative experiment of two independent experiments is shown. Differences between two groups were analyzed by Student’s t test. Differences among multiple groups were evaluated using one-way ANOVA with post hoc Tukey's multiple comparisons test. Histograms are shown as mean ± SD. Survival curves were generated via the Kaplan-Meier method and compared by log-rank test, and multiple comparisons were adjusted using the Bonferroni method. Statistical significance is depicted as follows: *, P < 0.05; **, P < 0.01; ***, P < 0.001. ns, not statistically significant.

