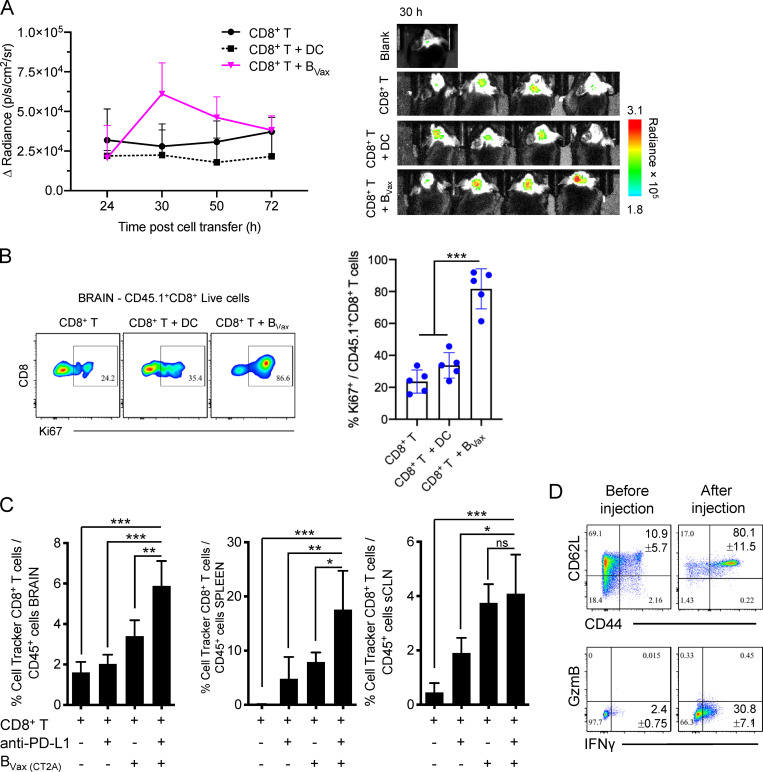
Figure 4.
BVax facilitates CD8+ T cell tumor infiltration and proliferation. (A) CT2A-bearing mice were irradiated 7 d after tumor implantation. 48 h later, mice received i.v. DC or BVax together with CellTracker Deep Red–labeled CD8+ T cells. Far-red signal emitted by CD8+ T cells was monitored at different time points (24, 30, 50, and 72 h). The experiment was performed using n = 4 mice/group. One mouse did not receive any lymphocytes and was used as a blank. In all experiments, mice were randomized and were grouped by treatment for the sole purpose of image capture. The fluorescence intensity was measured as photons per second per square centimeter per steradian (p/s/cm2/sr). (B) Alternatively, mice received DC or BVax (pulsed with CT2A lysates) concomitantly with CD8+ T cells from CD45.1 congenic mice. 48 h later, mice were evaluated for the proliferative status of adoptively transferred CD45.1+CD8+ T cells by measuring the expression of Ki67. The experiment was performed using n = 5 mice/group. (C) CT2A-bearing mice were irradiated 7 d after tumor injection. 24 h after irradiation, mice received i.v. CellTracker Red CMPTX–labeled CD8+ T cells ± BVax pulsed with CT2A tumor lysates i.v. ± anti–PD-L1 i.p. 7 d later, CellTracker Red CMPTX–labeled CD8+ T cell persistence (percentage of CellTracker+ CD8+T cells/total CD45+ leukocytes) was analyzed by flow cytometry in the tumor-bearing brains, the dCLNs, and superficial CLNs (sCLNs). (D) Adoptively transferred CD8+ T cells used in C were also phenotyped for CD44, CD62L, GzmB, and IFNγ in the dCLNs (after injection). The phenotype was compared with that before injection. The experiment was performed using n = 4 mice/group. For all experiments shown in this figure, differences among multiple groups were evaluated using one-way ANOVA with post hoc Tukey's test followed by post hoc Dunn's multiple tests. Histograms are shown as mean ± SD. Statistical significance is depicted as follows: *, P < 0.05; **, P < 0.01; ***, P < 0.001. ns, not statistically significant.

