Figure 6.
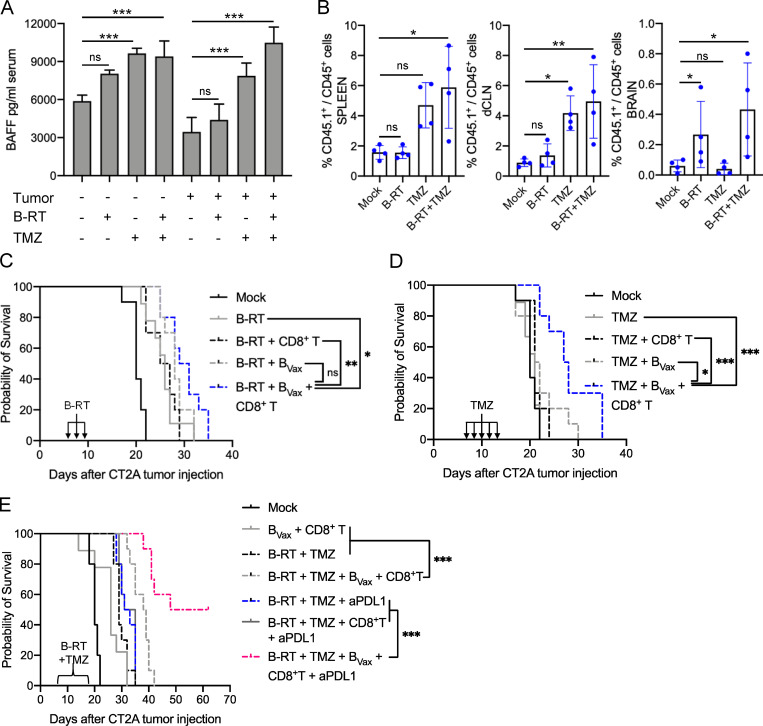
BVax-enhanced animal survival in combination with GBM SoC and PD-L1 blockade. (A) Mice received B-RTx for 3 consecutive d (D7–D10; 3 Gy each day) followed by 50 mg/kg of TMZ for 5 consecutive d (D11–D16). Serum BAFF levels were measured by ELISA 36 h after termination of the chosen therapy. Histograms are shown as mean ± SD. (B) BVax from congenic CD45.1+ mice were adoptively transferred into CD45.2+ CT2A-bearing mice (n = 4 mice/group). 7 d after cell adoptive transfer, CD45.1+ cells were analyzed by flow cytometry in the spleen, dCLNs, and tumor-bearing brains (n = 4 mice/group). (C) BVax ± CD8+ T cell therapeutic effect was tested in mice that received B-RTx. Non-irradiated (Mock, black line) and irradiated (B-RTx, gray line) mice were used as controls. Experimental groups received i.v. either CD8+ T cells (B-RTx + CD8+ T cells, dashed black line), BVax (B-RTx + BVax, dashed gray line), or both (B-RTx + BVax + CD8+ T cells, dashed blue line). The experiment was performed using n = 10 mice/group. (D) BVax ± CD8+ T cell therapeutic effect was tested in mice that were treated with TMZ. Untreated (Mock, black line) and TMZ-treated (TMZ, gray line) mice were used as controls. Experimental groups received i.v. either CD8+ T cells (TMZ + CD8+ T cells, dashed black line), BVax (TMZ + BVax, dashed gray line), or both (TMZ + BVax + CD8+ T cells, dashed blue line). The experiment was performed using n = 10 mice/group. (E) BVax + CD8+ T cell therapeutic effect was tested in mice treated with B-RTx and TMZ. Cellular therapy was administered 24 h after TMZ treatment termination (D19 after tumor challenge). Untreated mice (Mock, black line), mice that only received two i.v. injections of BVax + CD8+ T cells (BVax + CD8+ T, gray line), and irradiated mice that received TMZ (B-RTx + TMZ, dashed black line) were used as controls. Experimental groups treated with B-RTx and TMZ received two i.v. injections of BVax + CD8+ T cells (B-RTx + TMZ + BVax + CD8+ T, dashed gray line), two i.p. injections of PD-L1 blockade (aPD-L1; B-RTx + TMZ + aPDL1, dashed blue line), two i.v. injections of CD8+ T cells and two i.p. injections of PD-L1 blockade (B-RTx + TMZ + CD8+ T + aPDL1, gray line), or two i.v. injections of BVax + CD8+ T cells and two i.p. injections of PD-L1 blockade (B-RTx + TMZ + BVax + CD8+ T + aPDL1, dashed pink line). The experiment was performed using n = 10 or 11 mice/group. Differences among multiple groups were evaluated using one-way ANOVA with post hoc Tukey's test. Survival curves were generated via the Kaplan-Meier method and compared by log-rank test, and multiple comparisons were adjusted using the Bonferroni method. Statistical significance is depicted as follows: *, P < 0.05; **, P < 0.01; ***, P < 0.001. ns, not statistically significant.

