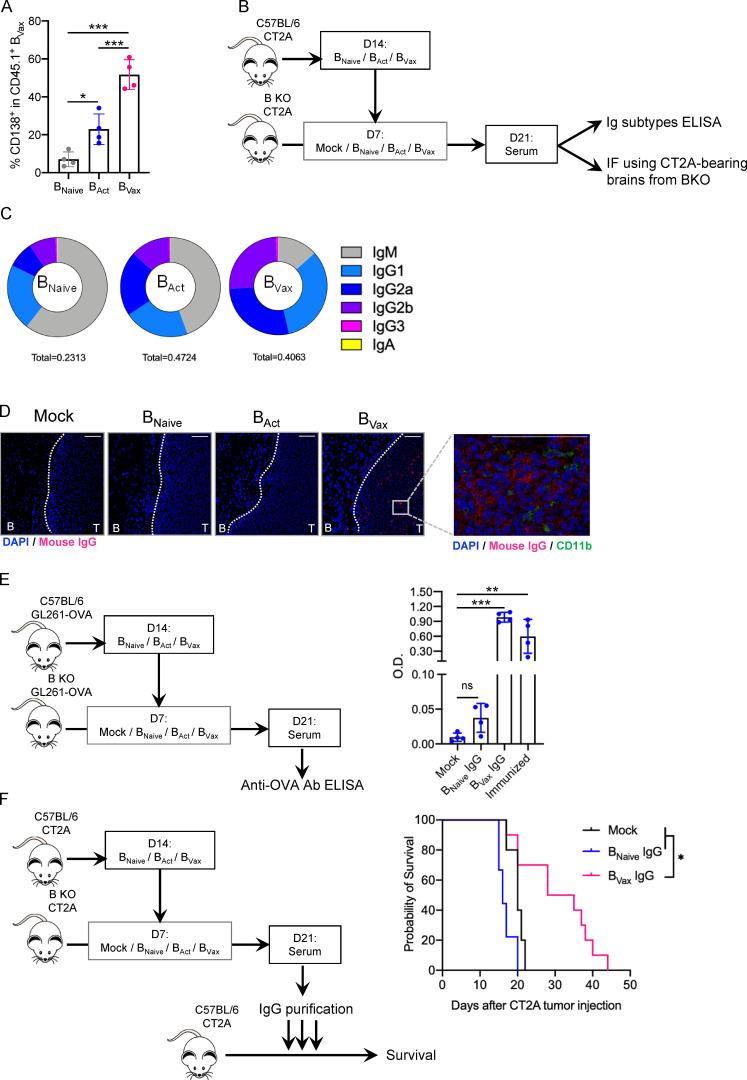
Figure 8.
BVax produce tumor-reactive Abs with therapeutic effect. (A) CD45.1+ BVax were adoptively transferred into B cell–deficient (B KO) CT2A-bearing mice. 72 h after, CD45.1+ BVax were evaluated for the expression of plasmablast marker CD138 by flow cytometry in the dCLN (n = 4/group). (B) Schema of BVax-derived serum Ig obtainment. (C) Diagram representing the distribution of different Ig subtypes from serum Abs derived from BNaive, BAct, and BVax. Ig subtype measurement of serum samples was performed by ELISA, and mean total Ig concentration is shown in the bottom of the diagram (in milligrams per milliliter). The experiment was performed in seven mice/group. (D) B cell subset IgG reactivity was measured by IF. Serum samples were incubated on tumor-bearing brain sections from B cell–deficient mice (B KO). Binding IgG was detected using anti-mouse IgG Cy5 (red) secondary Ab. Nuclei were detected using DAPI (blue), and myeloid cells were evaluated by using anti-mouse CD11b AF488 Ab (green). Scale bars represent 100 µm. A representative experiment of serum obtained in 4 mice/group is shown, performed twice independently. (E) BNaive, BAct, and BVax were generated from GL261-OVA tumor-bearing mice. B cells were allowed to produce Abs in GL261-OVA–bearing B KO mice. Serum samples were collected, and IgGs were purified and tested for their reactivity against OVA peptide SIINFEKL by ELISA. Semi-quantitative measurement is shown as optical density (OD). Sera from B cell–deficient mice and C57BL/6 SIINFEKL-immunized mice were used as negative and positive controls, respectively (n = 4/group). (F) Purified IgGs were tested for their therapeutic effect in the CT2A model. IgGs were delivered intracranially for 3 consecutive d (12.5 µg/mouse/injection). Untreated mice (black line) were used as controls. Experimental groups received either BNaive-derived IgG (BNaive IgG, blue line) or BVax-derived IgG (BVax IgG, pink line). The experiment was performed using n = 10 mice/group. Differences among multiple groups were evaluated using one-way ANOVA with post hoc Tukey's multiple comparisons test. Histograms are shown as mean ± SD. Survival curves were generated via the Kaplan-Meier method and compared by log-rank test, and multiple comparisons were adjusted using the Bonferroni method. Statistical significance is depicted as follows: *, P < 0.05; **, P < 0.01; ***, P < 0.001.ns, not statistically significant.

