Figure S4.
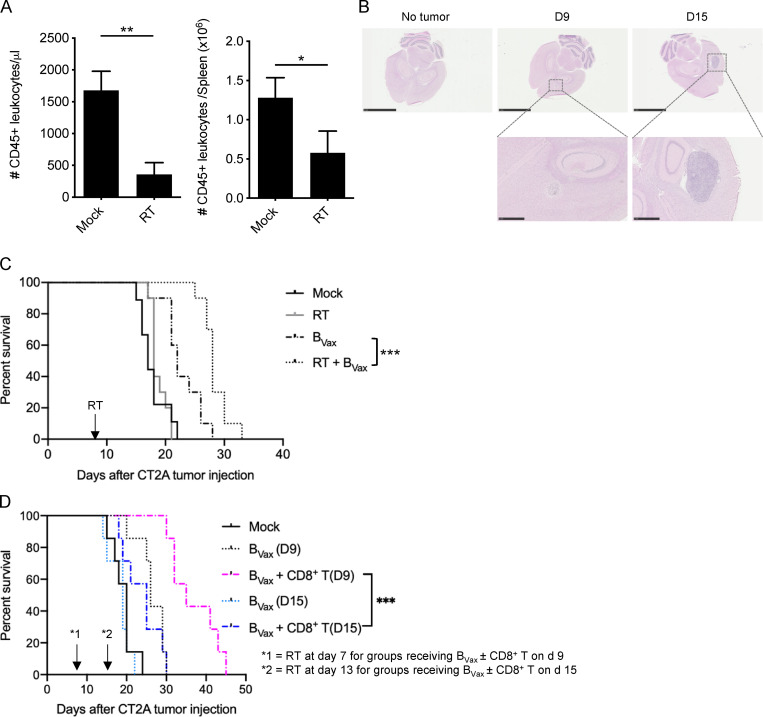
BVax therapeutic effect. (A) RT-induced systemic leukopenia measured by CD45+ leukocytes in blood and in the spleen (n = 4 mice/group). (B) Histological evaluation of CT2A tumor burden at different time points (9 [D9] and 15 d [D15] after tumor implantation). All mice received 9-Gy radiation 7 d after tumor inoculation. (C) BVax therapeutic effect was evaluated in animals that received RTx 7 d after tumor implantation and/or BVax treatment 9 d after tumor implantation (n = 10 mice/group). (D) BVax + CD8+ T cell treatment efficacy was tested at different time points: 9 and 15 d after tumor inoculation. All mice received RTx 7 d after tumor injection (n = 7 mice/group). Differences between the two groups were analyzed by Student’s t test. Histograms are shown as mean ± SD. Survival curves were generated via the Kaplan-Meier method and compared by log-rank test and multiple comparisons were adjusted using the Bonferroni method. Statistical significance is depicted as *, P < 0.05; **, P < 0.01; ***, P < 0.001. ns, not statistically significant.

