Figure S5.
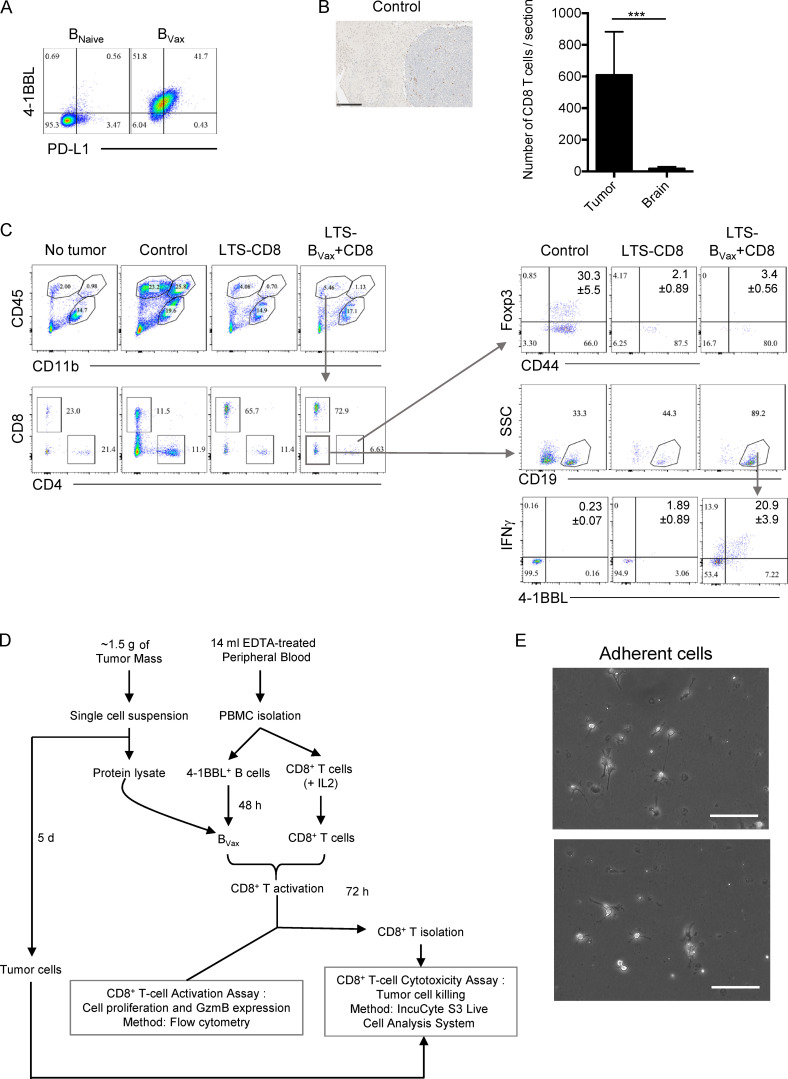
BVax treatment confers tumor eradication. (A) PD-L1 membrane expression was evaluated in BVax and BNaive cells. Representative dot plot of four independent experiments. Histograms are shown as mean ± SD. (B) CD8+ T cell infiltration in CT2A tumor in control group (14 d after tumor inoculation, n = 2). Scale bar represents 250 μm. Number of CD8+ T cells per section was assessed in the tumor area (tumor) versus nontumor (brain) area. (C) Immune cell infiltration in LTSs treated with either BVax and CD8+ T cells (LTS-BVax+CD8, n = 5) or only CD8+ T cells (LTS-CD8, n = 4) were compared with control CT2A-bearing (Control, n = 3) and Mock brains (No tumor, n = 2). Representative dot plot showing lymphocyte and myeloid cell compartment distribution (CD45 and CD11b expression) and CD8+ and CD4+ T cell distribution. Within the CD4+ T cell compartment, the expression of CD44 and Foxp3 was evaluated. Within the non–T cell compartment (CD8−CD4− lymphocytes), the CD19+ B cell compartment–expressing IFNγ and 4-1BBL was evaluated. Values of the populations of interest are shown as mean ± SD. Differences between two groups were analyzed by Student’s t test. Differences among multiple groups were evaluated using one-way ANOVA with post hoc Tukey's multiple comparisons test. GBM patient–derived BVax promoted anti-tumor CD8+ T cells. (D) Schema of generation of GBM patient–derived BVax. CD8+ T cell activation and expansion and CD8+ T cell–mediated tumor cell killing assay was performed in autologous settings. (E) Freshly resected tumors from GBM patients were cultured ex vivo as tumor spheroids. Representative picture of adherent cells after 5 d of culture. Scale bars represent 100 μm. SSC, side scatter.

