Figure 1.
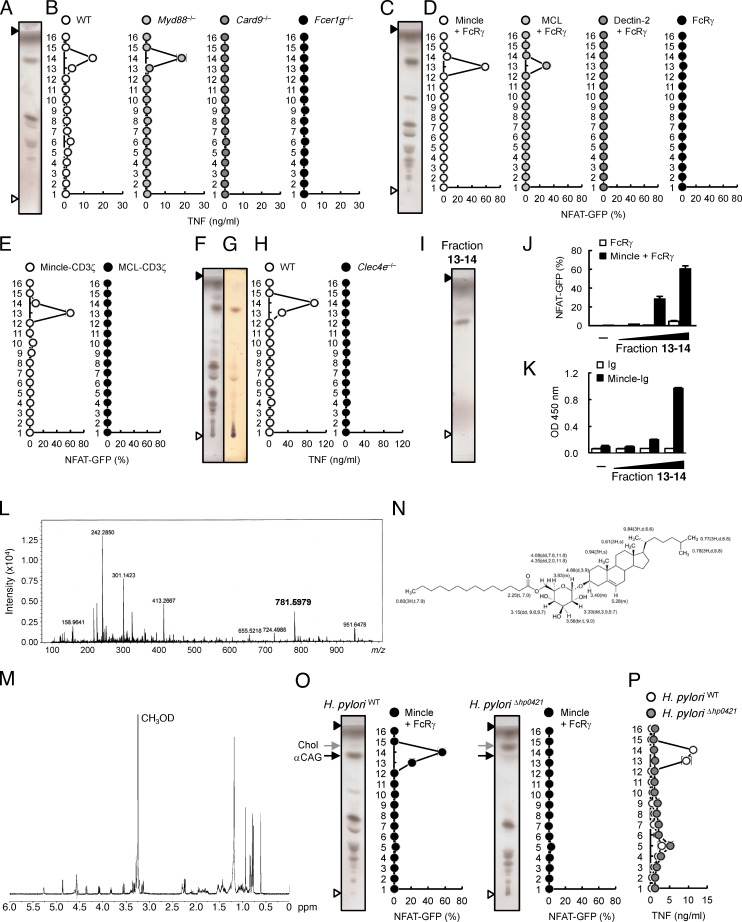
Identification of αCAG as the Mincle ligand in H. pylori. (A, C, F, G, I, and O) Lipid extract from H. pylori was analyzed by HPTLC using chloroform/methanol/water (65:25:4, vol/vol/vol) and stained with copper(II) acetate-phosphoric acid (A, C, F, I, and O) or orcinol (G). Open and closed arrowheads denote the origin and the solvent front, respectively. (B) BMDCs from WT, Myd88−/−, Card9−/−, and Fcer1g−/− mice were stimulated with HPTLC-separated fractions from H. pylori lipid extract for 1 d. The concentrations of TNF in the supernatants were determined by ELISA. (D) NFAT-GFP reporter cells expressing mouse (hereafter omitted for clarity unless needed) Mincle + FcRγ, MCL + FcRγ, Dectin-2 + FcRγ, or FcRγ alone were stimulated with HPTLC-separated fractions from H. pylori lipid extract for 20 h. Induction of GFP was analyzed by flow cytometry. (E) Mincle-CD3ζ– or MCL-CD3ζ–expressing NFAT-GFP reporter cells were stimulated by individual HPTLC-separated fractions of H. pylori lipid extract for 20 h. Induction of GFP was analyzed by flow cytometry. (H) BMDCs from WT and Clec4e−/− mice were stimulated with HPTLC-separated lipids from H. pylori lipid extract for 1 d. The concentrations of TNF in the supernatants were determined by ELISA. (I) Fraction 13-14 was purified by HPTLC using chloroform/methanol/water (65:25:4, vol/vol/vol) and visualized by copper(II) acetate-phosphoric acid staining. (J) Reporter cells expressing Mincle + FcRγ or FcRγ alone were stimulated by fraction 13-14 (0.01, 0.1 and 1 µg/well) for 20 h and analyzed for GFP expression. (K) Human Ig or Mincle-Ig was incubated with plate-coated fraction 13-14 (0.01, 0.1, and 1 µg/well). Bound proteins were detected with anti-human IgG-HRP. (L) Full-scan MS spectra of fraction 13-14 in the positive ion mode. Ion peak at m/z 781.5979 [M + Na]+ is assigned as cholesteryl acyl-pyranoside (calculated mass, 781.5953). (M) 1H-NMR (600 MHz, CDCl3:CD3OD [1:1], 298 K) spectrum of fraction 13-14. (N) Chemical structure and 1H-NMR chemical shifts assignment of fraction 13-14. Chemical shifts are given in δ ppm, followed by integration, multiplicity, and J in hertz. (O) Reporter cells expressing Mincle + FcRγ were stimulated by HPTLC-separated lipids from WT (H. pyloriWT) or Hp0421-deficient H. pylori (H. pyloriΔhp0421) for 20 h and analyzed for GFP expression. The black arrow indicates αCAG, and the gray arrow indicates cholesterol (Chol). (P) WT BMDCs were stimulated for 1 d with lipid subfractions from H. pyloriWT or H. pyloriΔhp0421 as in O. The concentrations of TNF in the supernatants were determined by ELISA. Data are presented as the mean ± SD of triplicate (B, H, K, and P) or duplicate (D, E, J, and O) assays and representative of two (B, D, E, H, K, O, and P) or four (J) independent experiments.

