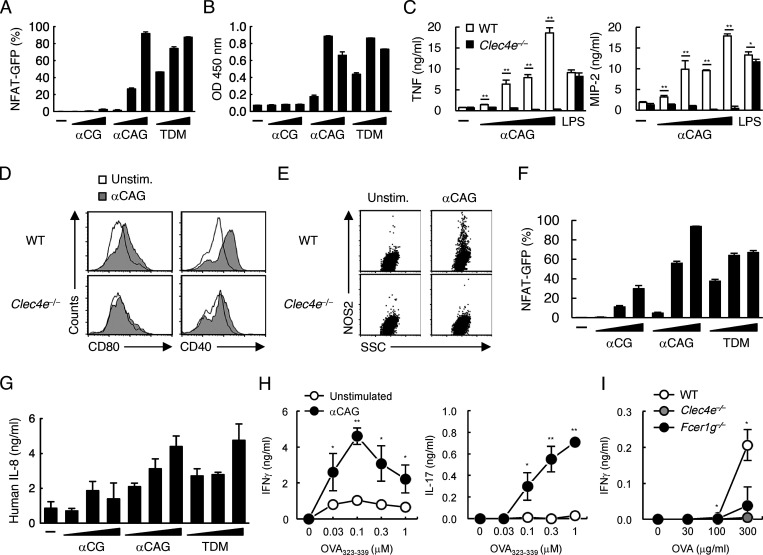
Figure 2.
αCAG induces innate and acquired immune responses as potent as TDM. (A) Reporter cells expressing Mincle + FcRγ were stimulated with αCG, αCAG C14:0, or TDM (0.003, 0.03, and 0.3 nmol/well) for 20 h and analyzed for GFP expression. (B) Binding of Mincle-Ig to plate-coated αCG, αCAG C14:0, or TDM (0.001, 0.01 and 0.1 nmol/well). Bound proteins were detected with anti-human IgG-HRP. (C) WT and Clec4e−/− BMDCs were stimulated with αCAG C14:0 (0.001, 0.01, 0.1, and 1 nmol/well) or LPS for 1 d and cytokine production was quantified. (D) WT and Clec4e−/− BMDCs were stimulated with αCAG C14:0 for 1 d and analyzed for the surface expression of CD80 and CD40. (E) IFN-γ–primed BMDCs were stimulated with αCAG C14:0 for 1 d and analyzed for the expression of intracellular NOS2. SSC, side scatter. (F) Reporter cells expressing human Mincle + FcRγ were stimulated with αCG, αCAG C14:0, or TDM (0.003, 0.03, and 0.3 nmol/well) and analyzed for GFP expression. (G) hMoDCs were stimulated with αCG, αCAG C14:0 or TDM (0.04, 0.1, and 0.3 nmol/well) for 1 d, and IL-8 production was quantified. (H) BMDCs were stimulated with 0.1 nmol/well of αCAG C14:0, and co-cultured with OT-II CD4+ T cells in the presence of OVA323–339 peptide for 3 d. Cytokine concentrations were measured by ELISA. (I) Mice were immunized with OVA + αCAG C14:0 and challenged with heat-aggregated OVA at 7 d after immunization. At day 7 after OVA challenge, B cell–depleted inguinal LN cells were stimulated with indicated amounts of OVA for 4 d, and IFN-γ production was quantified. The results of the statistical analysis show the difference between WT and Clec4e−/− mice. Data are presented as the mean ± SD of triplicate (B, C, G, and H) or duplicate (A, F, and I) assays and representative of three (A, B, F, and H), five (C and D), two (E and I), or four (G) independent experiments. An unpaired two-tailed Student’s t test was used for the statistical analyses. *, P < 0.05; **, P < 0.01.

