Figure 5.
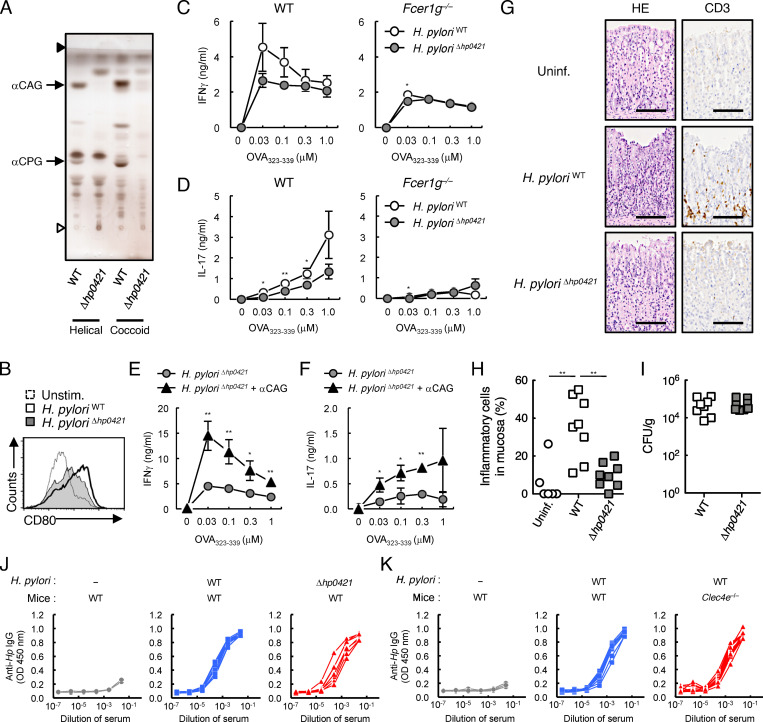
Ameliorated gastritis by depletion of αCAG/αCPG in H. pylori. (A) The lipid extracts from helical or coccoid form of H. pyloriWT or H. pyloriΔhp0421 were analyzed by HPTLC. Open and closed arrowheads denote the origin and the solvent front, respectively. The black arrows indicate αCAG and αCPG. (B) BMDCs were stimulated with multiplicity of infection (MOI) 30 of H. pyloriWT or H. pyloriΔhp0421 for 1 d, and the surface expression of CD80 was analyzed. (C and D) WT or Fcer1g−/− BMDCs were stimulated with MOI 30 (C) or 100 (D) of H. pyloriWT or H. pyloriΔhp0421 and co-cultured with OT-II CD4+ T cells in the presence of indicated concentrations of OVA323–339 peptide for 3 d. IFNγ (C) and IL-17 (D) productions were quantified by ELISA. (E and F) BMDCs were stimulated with H. pyloriΔhp0421 (MOI 30 in E or MOI 100 in F) alone or with 0.1 nmol/well of αCAG (C14:0) and co-cultured with OT-II CD4+ T cells. Cytokine production was quantified as in C and D. (G) H&E (HE) staining and immunohistochemical staining of anti-CD3 of stomach sections from H. pyloriWT– or H. pyloriΔhp0421-infected mice at 8 wk after infection. Uninfected WT mice were used as control. Scale bar, 100 µm. (H) The percentage of microscopic fields with inflammatory cells in one section of gastric mucosa. Two H&E-stained sections (14–25 fields) per mice were analyzed. (I) The number of bacteria recovered from the stomachs of H. pyloriWT– or H. pyloriΔhp0421–infected mice. Bacterial numbers were determined by counting the number of colonies on H. pylori selective agar plates. (J and K) Production of H. pylori–specific Ab in the sera of H. pyloriWT– or H. pyloriΔhp0421–infected WT mice (J), and H. pyloriWT–infected WT or Clec4e−/− mice (K). H. pylori–specific IgG was detected by ELISA using H. pylori lysate as an antigen. Each line represents an individual mouse. C57BL/6J mice obtained from CLEA Japan, Inc. were used as WT mice (G–I). Data are presented as the mean ± SD of triplicate assays (C–F) and representative of two independent experiments. An unpaired two-tailed Student’s t test was used for the statistical analyses. *, P < 0.05; **, P < 0.01.

