Figure 1.
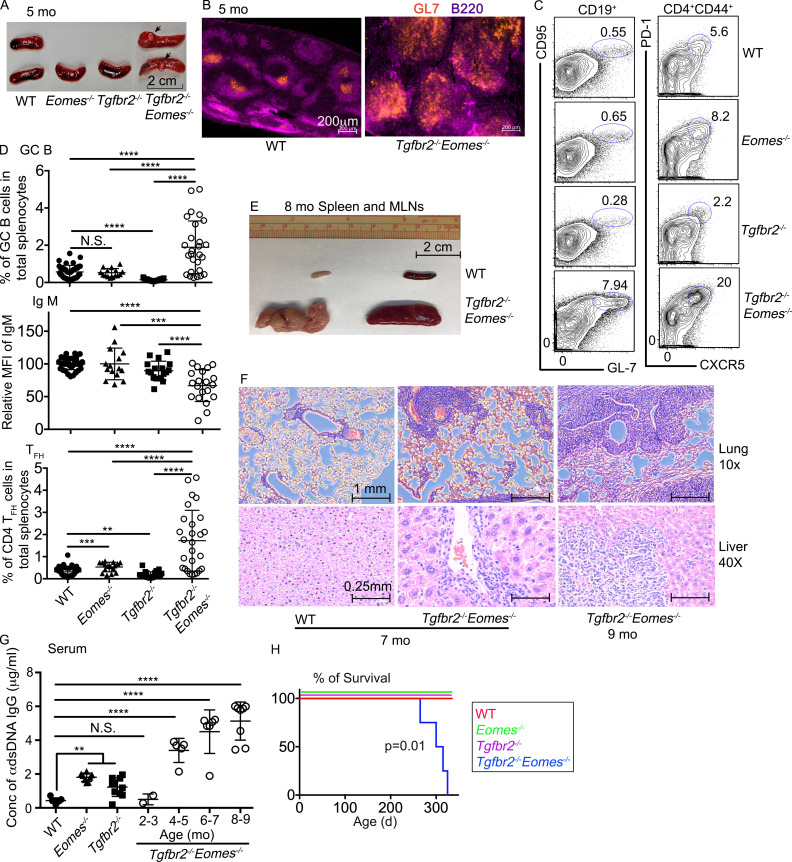
Dramatically enhanced spontaneous GC reaction in Tgfbr2−/−Eomes−/− mice. (A–D) The results from 5-mo-old mice are shown. (A) Representative picture of spleens. Arrows and circles indicate light-colored nodules on Tgfbr2−/−Eomes−/− spleens. (B) Representative images (n = 5) of WT and Tgfbr2−/−Eomes−/− spleens. (C) Representative FACS plots of pregated CD19+ (left) and CD4+CD44+ (right) splenic lymphocytes. (D) The percentage of GC B cells (CD19+CD95+GL-7+) in total splenic lymphocytes (top), mean fluorescence intensity (MFI) of IgM on B cells relative to the average value from WT controls in the same experiment (relative MFI, middle), and the percentage of CD4+ TFH cells (CD4+CD44+PD-1+CXCR5+) in total splenic lymphocytes (bottom) are shown. (E) Representative picture of spleen and mesenteric lymph nodes from 8-mo-old WT and Tgfbr2−/−Eomes−/− mice (n = 5). (F) Hematoxylin and eosin staining of lung and liver sections from 7–9-mo-old WT and Tgfbr2−/−Eomes−/− mice (n = 3). (G) Concentration (Conc) of serum anti-dsDNA IgG. (H) Survival curve (n = 11 for each group). Each symbol in D and G represents the results from an individual animal; bar graphs indicate the mean (± SEM). N.S., not significant; **, P < 0.01; ***, P < 0.001; ****, P < 0.0001 by one-way ANOVA with Tukey multi-comparison posttest for D and G. Mantel–Cox test was used for survival curve in H. Representative results from 3 (B, E, and F) or 10 (A and C) independent experiments are shown. Pooled results from 10 (D) or 3 (G) independent experiments are shown. For A, C, and D, WT, n = 41; Eomes−/−, n = 15; Tgfbr2−/−, n = 23; and Tgfbr2−/−Eomes−/−, n = 27. For G, WT, n = 7; Eomes−/−, n = 8; Tgfbr2−/−, n = 10; and Tgfbr2−/−Eomes−/−, n = 2 (2–3 mo), 5 (4–5 mo), 6 (6–7 mo), and 8 (8–9 mo).

