Figure 3.
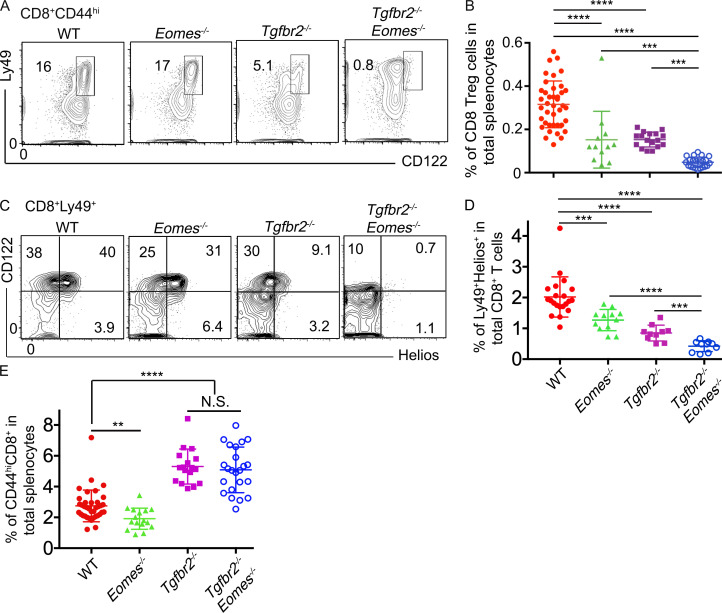
CD8+ T reg cells are severely defective in Tgfbr2−/−Eomes−/− mice. The results from 4–5-mo-old mice are shown. (A) Representative FACS plots of pregated CD8+CD44hi T cells. (B) The percentage of Ly49+CD122hiCD44hi CD8+ cells in total splenocytes. (C) Representative FACS plots of pregated CD8+Ly49+ T cells. (D) The percentage of Ly49+Helios+ cells in total CD8+ T cells. (E) The percentage of CD44hiCD8+ cells in spleen. Representative results from 6 (C) or 10 (A) independent experiments are shown. Pooled results from 6 (D) or 10 (B and E) independent experiments are shown. Each symbol in B, D, and E represents the results from an individual animal. N.S., not significant; **, P < 0.01; ***, P < 0.001; ****, P < 0.0001 by one-way ANOVA with Tukey multi-comparison posttest (E) or Student’s t test (B and D). WT, n = 41 (A and B), 21 (C and D), or 37 (E); Eomes−/−, n = 13 (A and B), 12 (C and D), or 16 (E); Tgfbr2−/−, n = 17 (A, B, and E) or 10 (C and D); and Tgfbr2−/−Eomes−/−, n = 22 (A and B), 10 (C and D), or 23 (E).

