Figure 7.
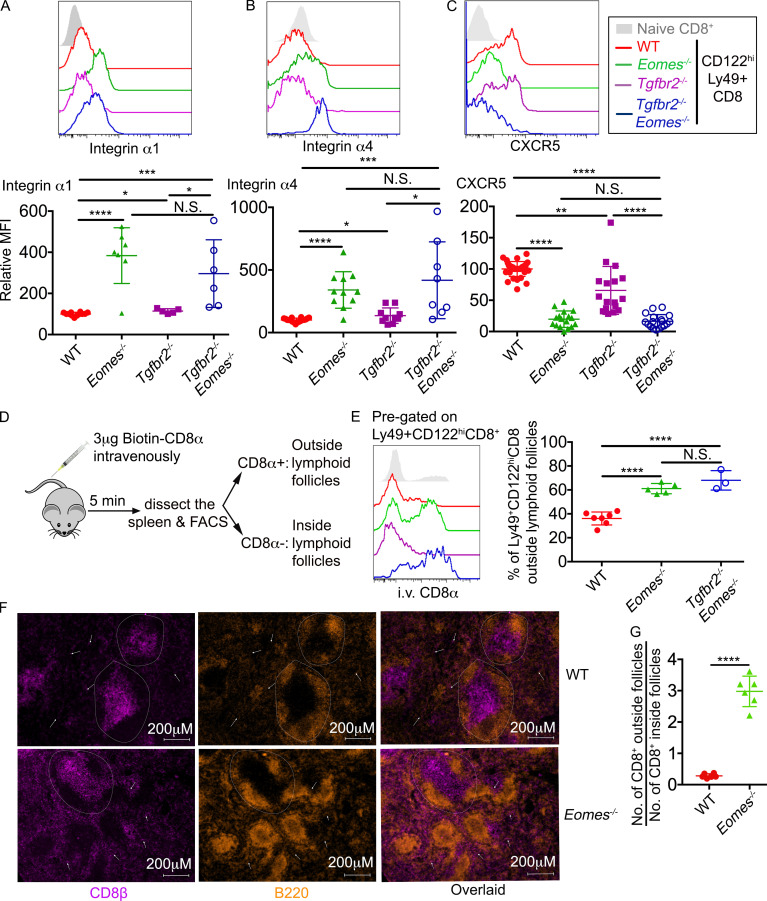
An Eomes-dependent genetic program controls the location of CD8+ T reg cells. (A–C) The expression of integrin α1 (A), integrin α4 (B), and CXCR5 (C) on pregated CD8+ T reg cells are shown. Pooled results from six independent experiments are shown (A–C). (D) Schematic of intravascular labeling of CD8+ T cells. (E) Representative FACS plot of pregated CD8+ T reg cells (seft) and pool results from three independent experiments (right) are shown. (F) Representative images of WT and Eomes−/− spleen (n = 3). Dashed circles provide examples of follicles. White arrows indicate CD8+ T cells outside follicles. (G) The ratio of CD8+ T cell number outside vs. inside follicles. Each number was calculated from an area of 2.39 mm2 containing two to seven follicles. Representative (F) or pooled results (G) from two independent experiments are shown with a total of 20 WT and 20 Eomes−/− follicles analyzed. All mice are 3–6 mo of age. Each symbol represents the results from an individual animal. N.S., not significant; *, P < 0.05; **, P < 0.01; ***, P < 0.001; ****, P < 0.0001 by one-way ANOVA with Tukey multi-comparison posttest (E) or Student’s t test (A, B, C, and G). WT, n = 12 (A), 18 (B), 34 (C), or 7 (E); Eomes−/−, n = 7 (A), 11 (B), 17 (C), or 5 (E); Tgfbr2−/−, n = 5 (A), 10 (B), or 17 (C); Tgfbr2−/−Eomes−/−, n = 6 (A), 8 (B), 18 (C), or 3 (E).

