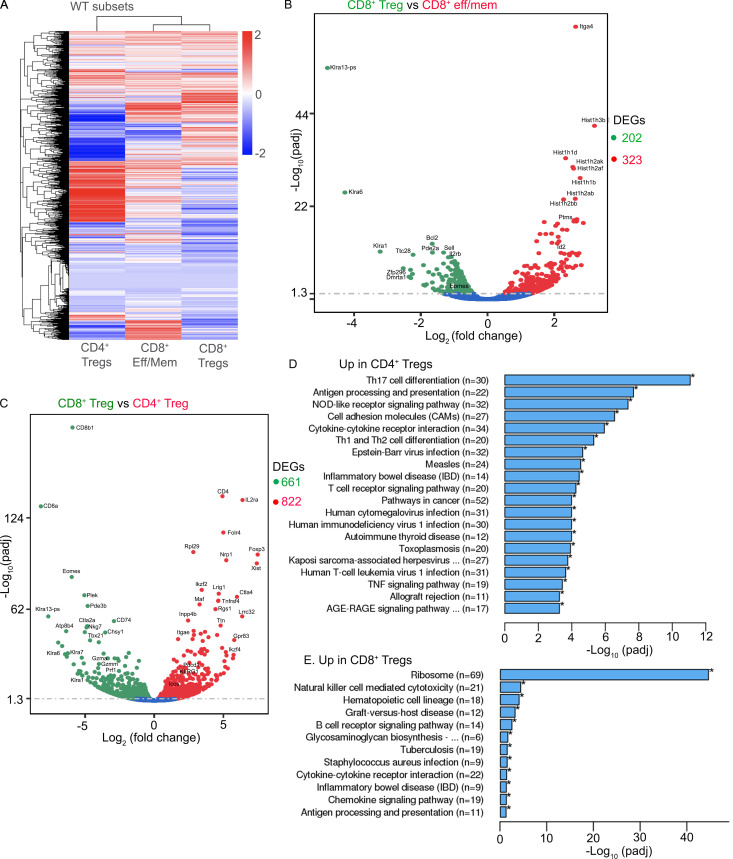
Figure S3.
Distinct transcription profiles of CD4+ vs. CD8+ T reg cells in WT mice. FACS-sorted CD4+ T reg cells (based on Foxp3-GFP; n = 2), CD8+ T reg cells (CD8+CD44hi CD122hiLy49+; n = 1), and effector (eff)/memory (mem)–like CD8+ T cells (CD8+CD44hiCD49d+; n = 2) from WT mice were subjected to global RNA-seq analysis. (A) Heatmap of differentially expressed genes (DEGs). (B and C) Volcano plots of CD8+ T reg cells vs. effector/memory-like CD8+ T cells (B) or CD8+ T reg cells vs. CD4+ T reg cells (C). Numbers on the right of volcano plots indicate the total number of DEGs between the groups. DEGs between CD4+ and CD8+ T reg cells are subjected to Kyoto Encyclopedia of Genes and Genomes pathway analysis. Significantly enriched pathways are shown in D and E.

