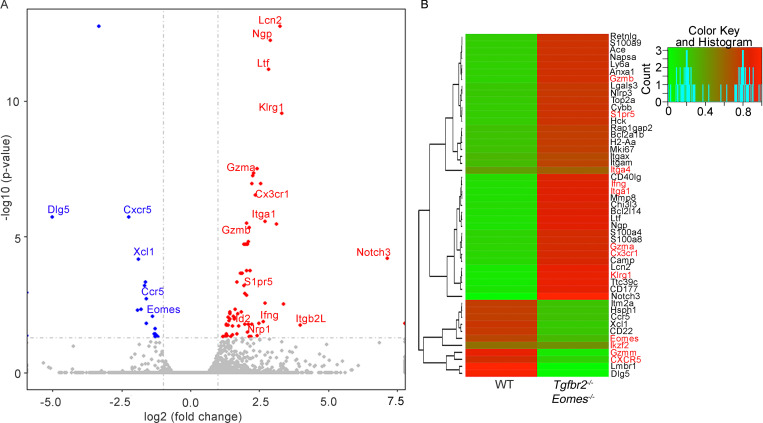
Figure S4.
RNA-seq analysis of Ly49+CD122hi CD8+ T cells isolated from WT and Tgfbr2−/−Eomes−/− mice. (A and B) Volcano plot (A) and heatmap (B) of selected differentially expressed genes (DEGs) are shown (n = 1). Complete list of differentially expressed genes is shown in Table S1.

