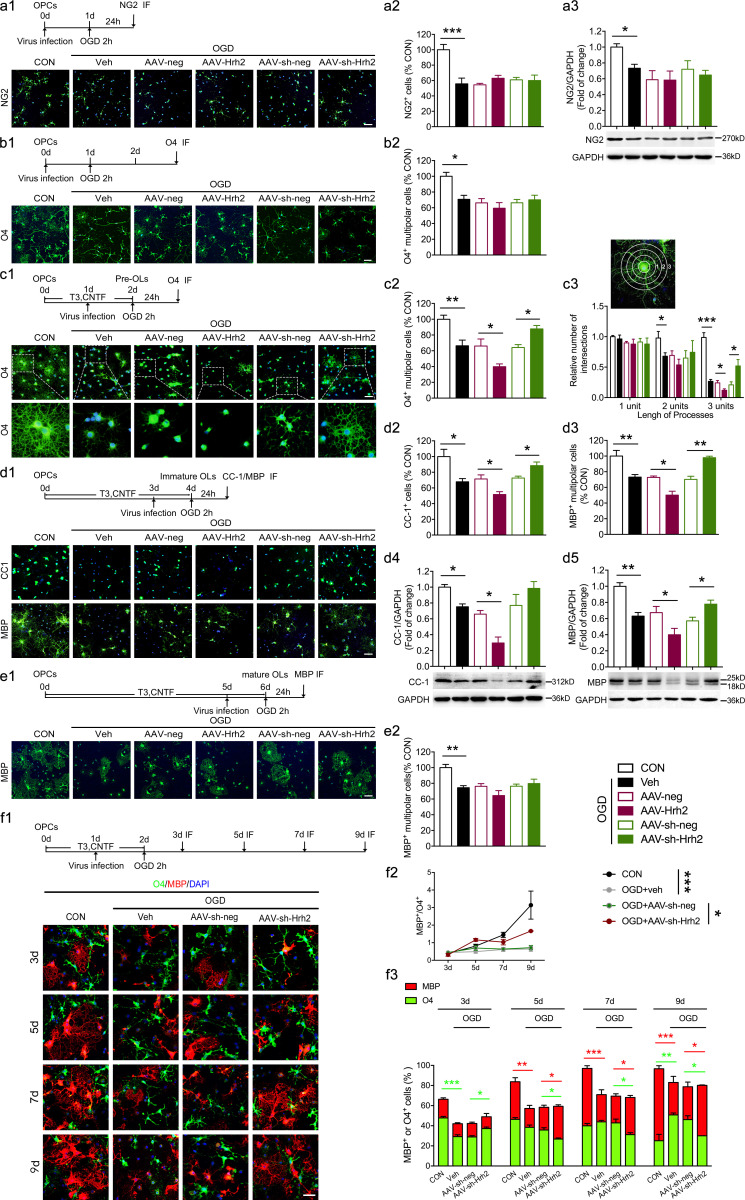
Figure 1.
H2R negatively regulates OL differentiation following OGD in vitro. (a1–a3) The primary cultured OPCs or oli-neu cells were infected with AAV-Hrh2 or AAV-sh-Hrh2 and subjected to OGD/reperfusion. Immunocytochemical visualization (a1) and the quantification of numbers of NG2+ OPCs (a2) at 24 h after reperfusion. (a3) Western blot analysis of NG2+ expression in oli-neu cells at 24 h after reperfusion. (b1 and b2) The primary cultured OPCs were infected with AAV-Hrh2 or AAV-sh-Hrh2 and subjected to OGD/reperfusion. Immunocytochemical visualization (b1) and the quantification of numbers of O4+ multipolar cells (b2) at 2 d after reperfusion. (c1–c3) The primary cultured OPCs were differentiated into preOLs with incubation in T3 (40 ng/ml) and CNTF (10 ng/ml) for 2 d. The preOLs infected with AAV-Hrh2 or AAV-sh-Hrh2 were subjected to OGD/reperfusion. Immunocytochemical visualization (c1) and the quantification of numbers of O4+ multipolar OLs (c2) at 24 h after reperfusion. The cells in the box portion in c1 were enlarged in the bottom panel. (c3) The process extensions for O4+ multipolar OLs were analyzed using Sholl analysis. Branching was quantified by measuring the number of intersections that processes made with concentric circles, which are numbered 1–3 to reflect increasing distance from the cell body. (d1–d5) The primary cultured OPCs or oli-neu cells were differentiated into immature OLs with incubation in T3 (40 ng/ml) and CNTF (10 ng/ml) for 4 d. The immature OLs infected with AAV-Hrh2 or AAV-sh-Hrh2 were subjected to OGD/reperfusion. Immunocytochemical visualization (d1) and the quantification of numbers of CC-1+ mature OLs (d2) or MBP+ multipolar mature OLs (d3) at 24 h after reperfusion. (d4 and d5) Western blot analysis of CC-1+ and MBP+ expression in oli-neu cells at 24 h after reperfusion. (e1 and e2) The primary cultured OPCs were differentiated into mature OLs with incubation in T3 (40 ng/ml) and CNTF (10 ng/ml) for 6 d. The mature OLs infected with AAV-Hrh2 or AAV-sh-Hrh2 were subjected to OGD/reperfusion. Immunocytochemical visualization (e1) and the quantification of numbers of MBP+ multipolar mature OLs (e2) at 24 h after reperfusion. (f1–f3) The primary cultured OPCs were differentiated into preOLs with incubation in T3 (40 ng/ml) and CNTF (10 ng/ml) for 2 d. The preOLs infected with AAV-sh-Hrh2 were subjected to OGD/reperfusion. Immunocytochemical visualization (f1) and the quantification of percentage of O4+ (MBP−) multipolar OLs and MBP+ multipolar OLs (f3) at 1 d, 3 d, 5 d, and 7 d after reperfusion (3 d, 5 d, 7 d, and 9 d differentiated from OPCs). (f2) The ratio of the MBP+ multipolar OL numbers to O4+ (MBP−) multipolar OL numbers. Green: NG2 labels OPCs in a1; O4 labels preOLs in b1, c1, or f1; CC-1 and MBP label mature OLs in d1 or e1. Red, MBP labels mature OLs in f1; blue, DAPI. Scale bar, 50 µm. n = 4–6 from at least three independent experiments. *, P < 0.05; **, P < 0.01; ***, P < 0.001. The red asterisks represent the P value of the change in the numbers of MBP+ multipolar mature OLs, and the green asterisks represent the P value of the change in the numbers of O4+ (MBP−) multipolar differentiating OLs in f3. CON, control; IF, immunofluorescence staining; Veh, vehicle.

