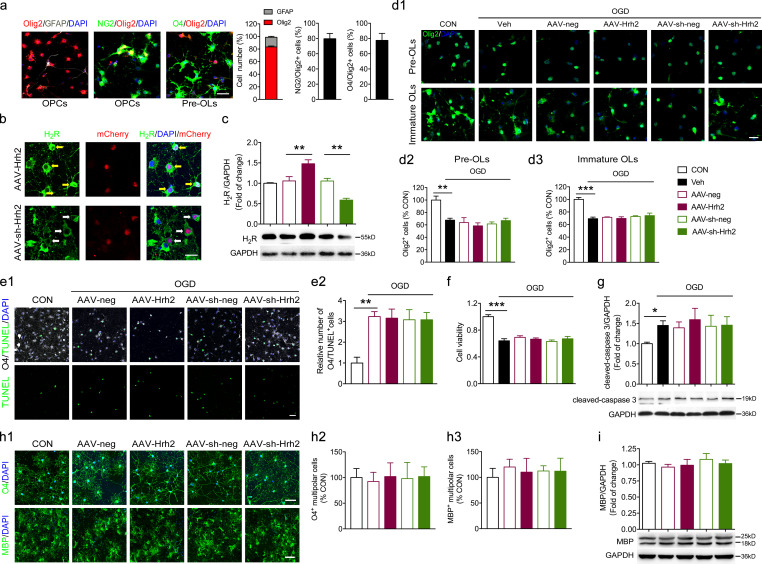
Figure S2.
The effect of overexpression and knockdown of H2R on cultured OLs. (a) The primary cultured OPCs were differentiated into preOLs with incubation in T3 (40 ng/ml) and CNTF (10 ng/ml) for 2 d. Immunocytochemical staining of Olig2 together with GFAP, NG2, or O4 was performed to confirm the purity of OPCs (NG2) or preOLs (O4), respectively. The percentage of Olig2+ OL lineage (and the percentage of astrocytes) in cultured cells as well as the percentage of NG2+ OPC and O4+ multipolar preOLs among all the Olig2+ OLs were quantified. Scale bar, 50 µm. (b and c) The AAV-Hrh2 and AAV-sh-Hrh2 infection efficiency was evaluated by immunocytochemical staining in primary cultured OLs (b) and Western blot analysis of oli-neu cells (c). (d1–d3) The primary cultured OPCs were differentiated into preOLs or immature OLs with incubation in T3 (40 ng/ml) and CNTF (10 ng/ml) for 2 d or 4 d, respectively. These preOLs or immature OLs transfected with AAV-Hrh2 or AAV-sh-Hrh2 were subjected to OGD/reperfusion. The total number of Olig2+ OL lineages was quantified at 24 h after reperfusion. Scale bar, 20 µm. (e1, e2, f, and g) The primary cultured OPCs or oli-neu cells were differentiated into preOLs with incubation in T3 (40 ng/ml) and CNTF (10 ng/ml) for 2 d. These preOLs infected with AAV-Hrh2 or AAV-sh-Hrh2 were subjected to OGD/reperfusion. (e1 and e2) Immunocytochemical visualization and the quantification of numbers of O4 and TUNEL double-positive OLs at 24 h after reperfusion. (f) Cell viability tested by MTT assay in oli-neu cells at 24 h after reperfusion. (g) Western blot analysis of cleaved-caspase3 in oli-neu cells at 24 h after reperfusion. (h1–h3 and i) The primary cultured OPCs or oli-neu cells were differentiated into preOLs or immature OLs with incubation in T3 (40 ng/ml) and CNTF (10 ng/ml) for 2 d or 4 d, respectively. These preOLs or immature OLs transfected with AAV-Hrh2 or AAV-sh-Hrh2 were allowed further differentiation for 1 d. Immunocytochemical visualization (h1) and the quantification of numbers of O4+ multipolar cells differentiated from preOLs (h2). Immunocytochemical visualization (h1) and the quantification of numbers of MBP+ multipolar cells differentiated from immature OLs (h3). Scale bar, 50 µm. (i) Western blot analysis of the MBP expression in oli-neu cells differentiated from immature stage. n = 4–6 trials from at least three independent experiments. *, P < 0.05; **, P < 0.01; ***, P < 0.001. CON, control; Veh, vehicle.

