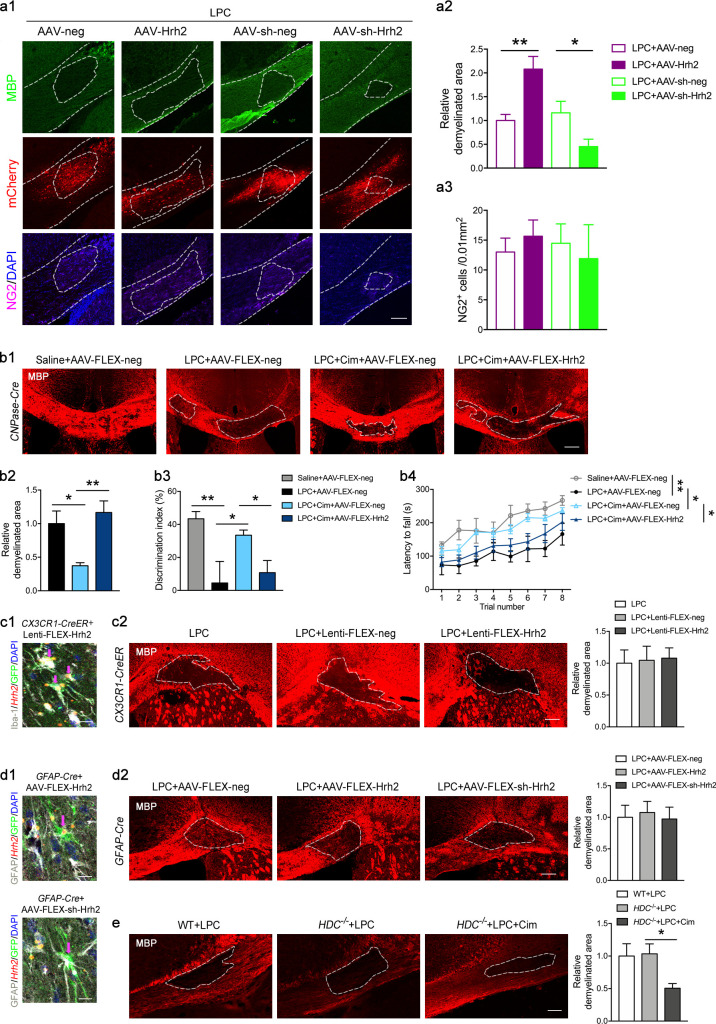
Figure S3.
The effect of overexpression and knockdown of H2R on remyelination and neurological function in LPC-induced demyelination model. (a1–a3) Mice were injected with AAV-Hrh2 or AAV-sh-Hrh2 to overexpress or knock down H2R, and then received the LPC injection in the right side of the corpus callosum. Immunocytochemical visualization (a1) and quantification of demyelinated area in MBP staining (a2) and NG2+ OPCs (a3) in the LPC-induced demyelinated area at 10 dpl. The location of virus injection was indicated by mCherry (red) expression. (b1–b4) CNPase-Cre mice were injected with AAV-FLEX-Hrh2 to overexpress H2R in differentiating OLs (or AAV-FLEX-neg as control), and then received LPC injection in two sites of the corpus callosum and cimetidine treatment (Cim). Immunocytochemical visualization (b1) and quantification of demyelinated area in MBP staining (b2) at 10 dpl, as well as motor coordination in rotarod test (b3) and cognitive ability in object recognition test (b4) at 9–10 dpl. (c1 and c2) CX3CR1-Cre mice were received Lenti-FLEX-Hrh2 infection to overexpress H2R in microglia, and then received the LPC injection in the right side of corpus callosum. (c1) In situ hybridization of Hrh2 mRNA by RNAscope, immunostaining of Iba-1 and GFP, and visualization of nuclei by DAPI in the corpus callosum to confirm the overexpression H2R in microglia (arrows indicate the virus-infected Iba-1+ microglia). (c2) Immunocytochemical visualization and quantification of demyelinated area in MBP staining at 10 dpl. (d1 and d2) GFAP-Cre mice received AAV-FLEX-Hrh2 or AAV-FLEX-sh-Hrh2 infection to overexpress or knock down H2R, and then received the LPC injection in the right side of the corpus callosum. (d1) In situ hybridization of Hrh2 mRNA by RNAscope, immunostaining of GFAP and GFP, and visualization of nuclei by DAPI in the corpus callosum to confirm the overexpression or knockdown of H2R in astrocytes (arrows indicate the virus infected GFAP+ astrocytes). (d2) Immunocytochemical visualization and quantification of demyelinated area in MBP expression at 10 dpl. (e) HDC−/− mice received the LPC injection in the right side of the corpus callosum and were administered cimetidine. Immunocytochemical visualization and quantification of demyelinated area in MBP staining at 10 dpl. All scale bars, 100 µm. n = 5 or 6 mice for each group from at least three independent experiments in a1–a3, b1, b2, c1, c2, d1, d2, and e; n = 7 or 8 mice for each group from at least three independent experiments in b3 and b4. The areas outlined by a dashed line indicate the demyelinated areas. *, P < 0.05; **, P < 0.01.

