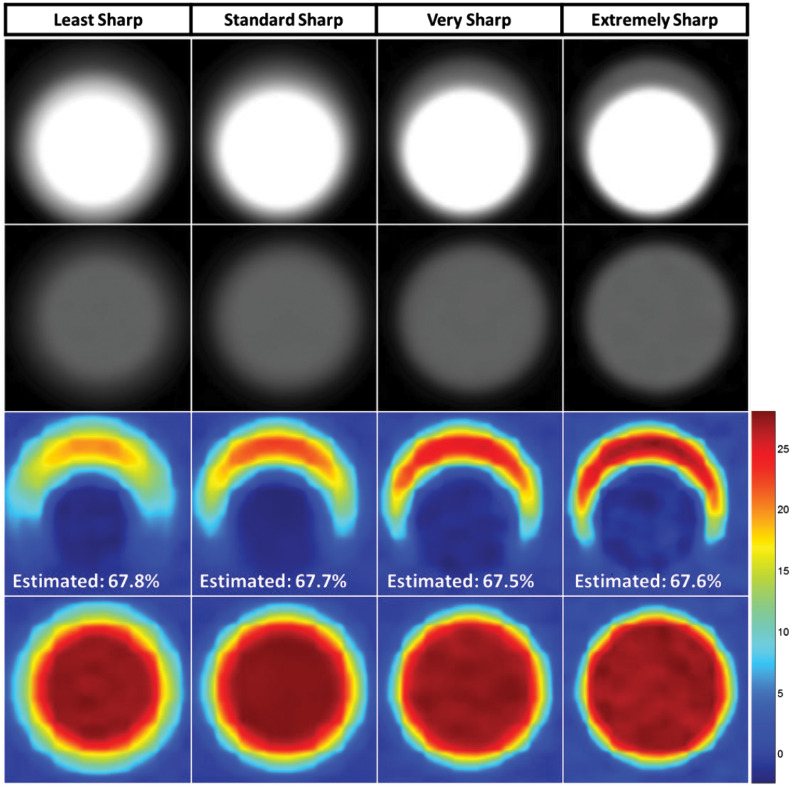
Fig. 4.
Validation simulation results. First row: MECT images with four different degrees of sharpness. Second row: Corresponding images of the stenosis-free reference vessel. Third row: Iodine density maps (in mg/ml) were generated from material decomposition at the level of a stenosis and without a stenosis. As spatial resolution was varied (from left to right), the size and densities of the iodine map also varied. However, for all four sharpness levels, the proposed method achieved accurate measurement of the percent area stenosis, with errors below 1.2% across all sharpness levels (true percent area stenosis = 66.6%).

