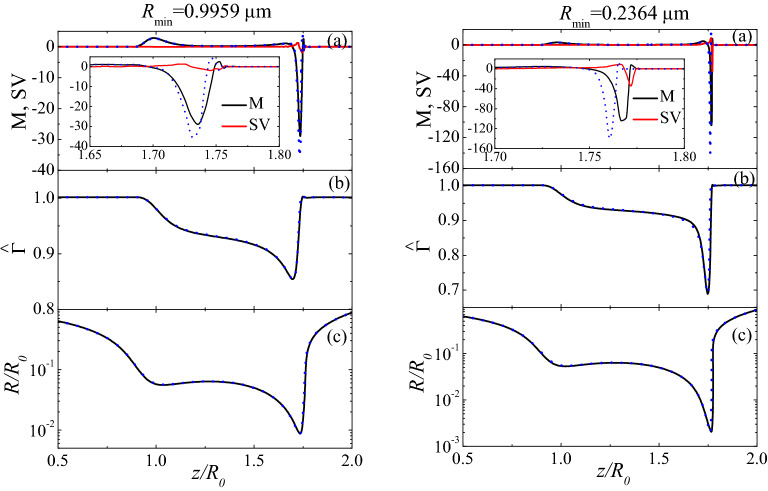
Figure 4.
Axial distribution of the Marangoni stress M and tangential shear viscous stress SV (a), surfactant surface concentration (b), and free surface radius (c) for DIW+SDS 0.8cmc. The solid lines are the results for , Pa s m, while the dotted lines correspond to the the Marangoni stress M for (in the left-hand graphs, m for ; in the right-hand graphs, m for ). The results were calculated for , Oh=0.0151, , Pe, Oh, and Oh (solid lines) and 0 (dotted lines) (see “Methods” section).

