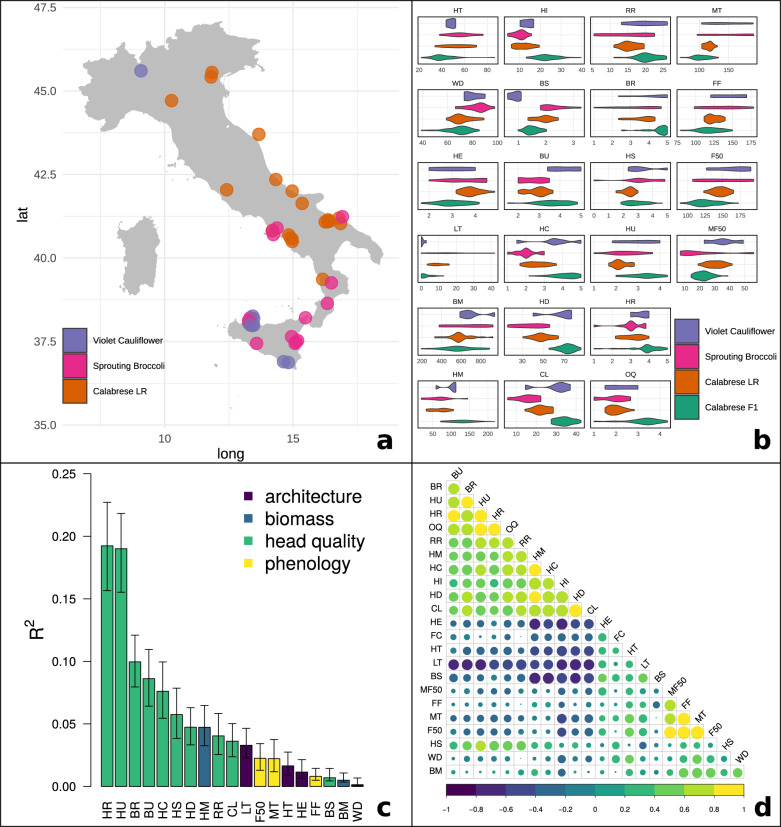
Fig. 6. Phenotypic summary of accessions evaluated in field trials.
a Collection locations Italian landraces with provenances. Color indicates inferred subpopulation membership derived from structure analysis. Jitter is added to points to distinguish accessions collected at the same location. b Trait distribution disaggregated by subpopulation (Supplementary Table 2 for units). c Proportional contribution of traits to overall quality (OQ) by relative importance analysis using 1000 bootstraps of the lmg algorithm. d Spearman correlation matrix between all evaluated traits; positive and negative correlations are printed in yellow and blue, with circle size scaled to magnitude

