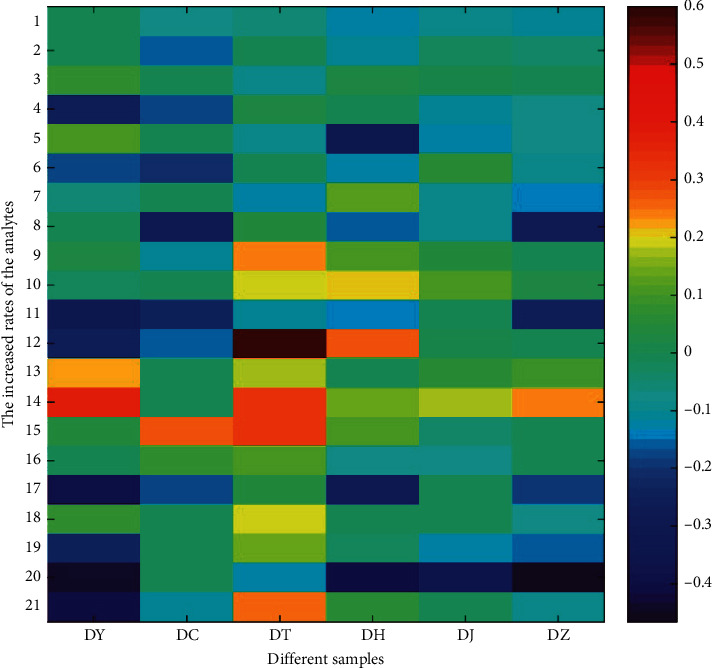
Figure 5.

The heat map of increased rates of target constituents in six different separated prescriptions (DY, DC, DT, DH, DJ, and DZ). The increased rate of 0 indicates that the observed amount was equal to its theorized amount, otherwise denoting amount increases (>0) or amount decreases (<0) in the separated prescriptions.
