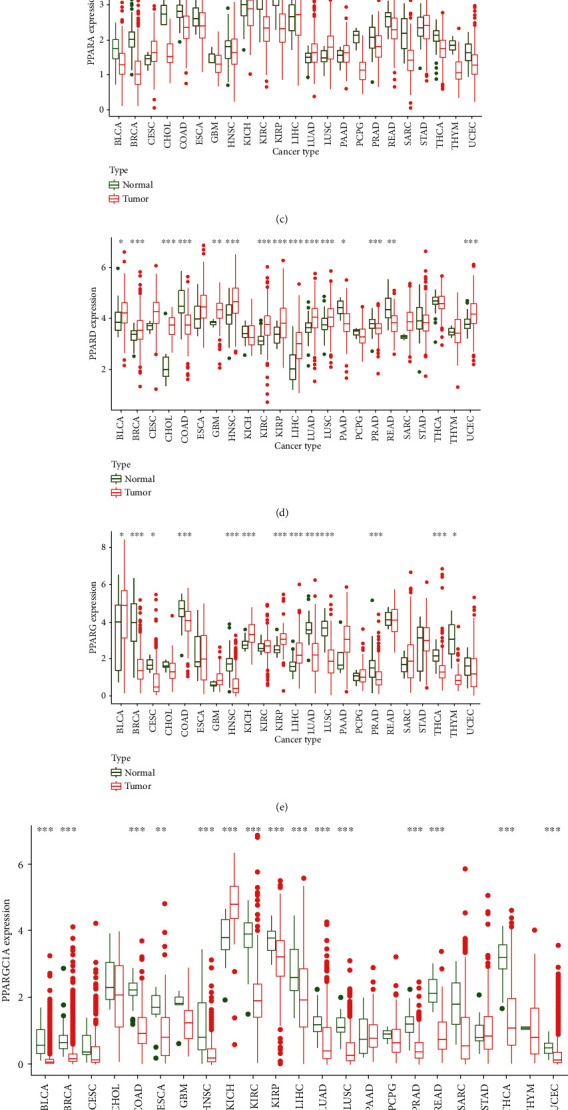
Figure 2.

Differential expression analysis. (a) The box plot showing the transcriptional expression levels of PPARs. (b) The heatmap showing the transcriptional level of PPARs in TCGA tumor types compared to normal tissues; the gradient colors represent the log Fold Change (logFC) value. (c–g) The box plots showing differential expression of PPARs and PPARGC1A and PPARGC1B in normal and tumor tissues (∗∗∗p < 0.001; ∗∗p < 0.01; ∗p < 0.05); (h) the correlation coefficients by coexpression analysis between every two genes are presented.
