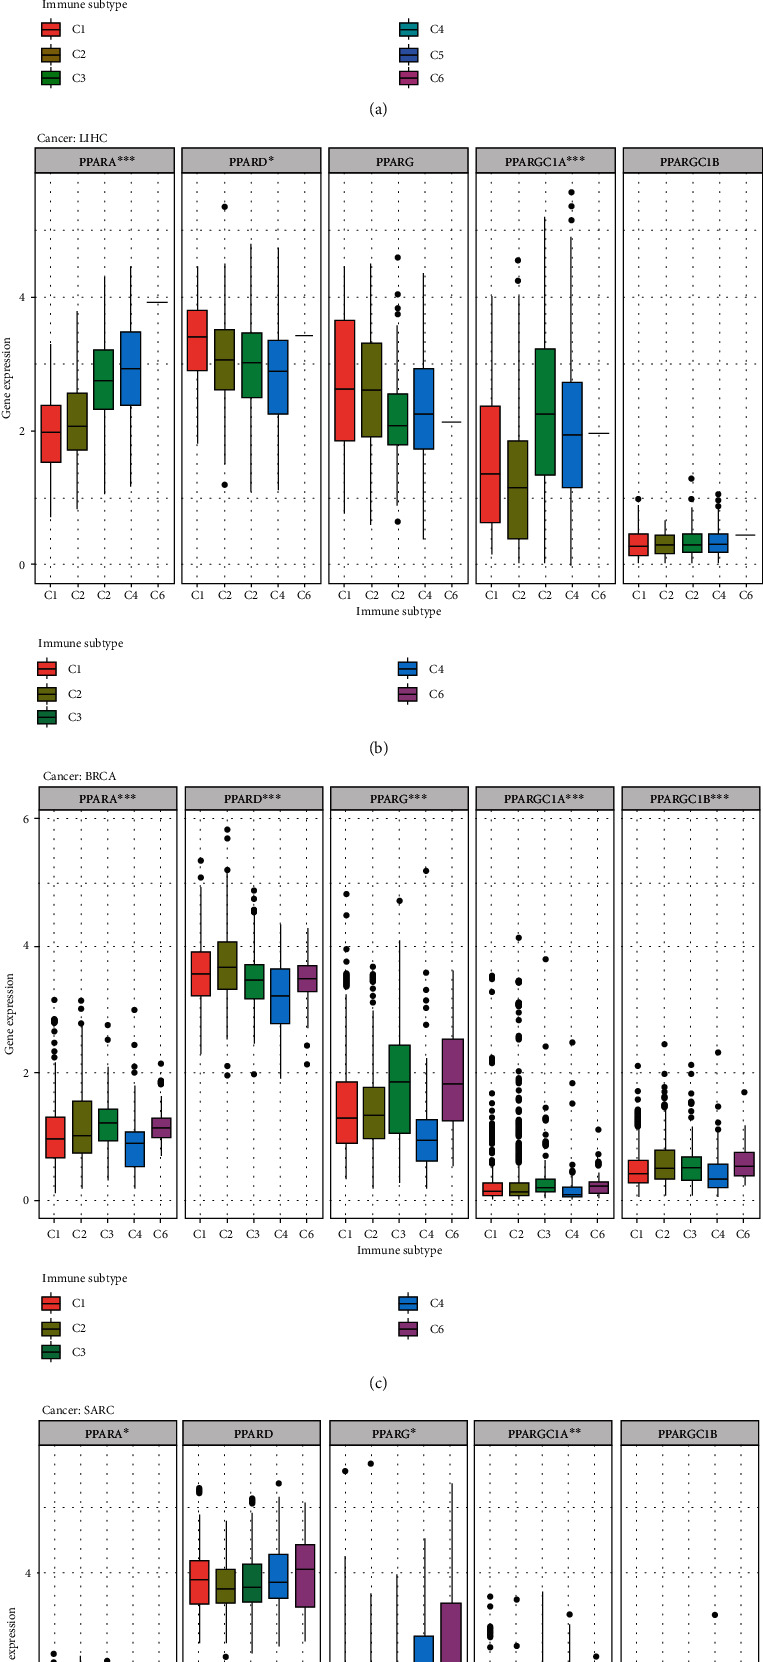
Figure 5.

The results of correlation analysis between members of PPAR and immune subtypes. (a) The transcriptional expression of PPARs in C1-C6 immune subtypes across TCGA cancers. (b–d) Box plots showing the expression level of PPAR immune subtypes in LIHC, BRCA, and SARC, respectively (∗∗∗p < 0.001; ∗∗p < 0.01; ∗p < 0.05). LIHC: liver hepatocellular carcinoma; BRCA: breast invasive carcinoma; SARC: Sarcoma.
