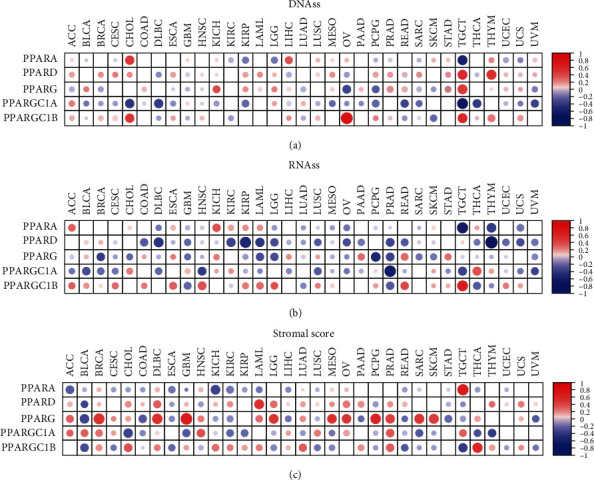
Figure 6.

The results of correlation analysis between members of PPAR and stemness indices and microenvironment scores. (a, b) The two heatmaps showing the correlation of the expression level of PPARA, PPARD, PPARG, PPARGC1A, and PPARGC1B and stemness indices (DNAss and RNAss) in 33 TCGA cancer types. DNAss: DNA methylation-based stemness score; RNAss: RNA-based stemness score. (c) The heatmap showing the correlation between stromal scores and the mRNA expression of PPARs (red points represent a positive correlation while blue points represent a negative correlation).
