
Figure 8.
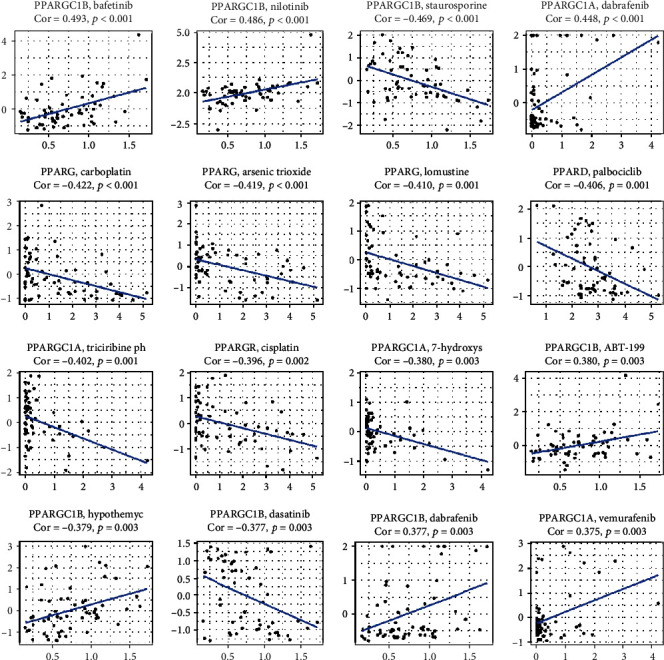
Drug response analysis. The correlation between drug sensitivity and PPARA, PPARD, PPARG, PPARGC1A, and PPARGC1B across TCGA cancers. The scatter plots are ranked by p value.
Official websites use .gov
A
.gov website belongs to an official
government organization in the United States.
Secure .gov websites use HTTPS
A lock (
) or https:// means you've safely
connected to the .gov website. Share sensitive
information only on official, secure websites.
Drug response analysis. The correlation between drug sensitivity and PPARA, PPARD, PPARG, PPARGC1A, and PPARGC1B across TCGA cancers. The scatter plots are ranked by p value.