Figure 8.

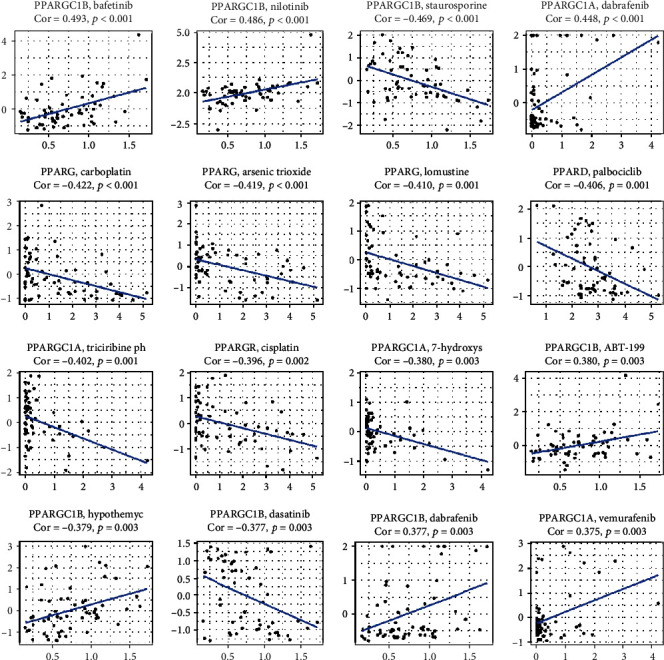
Drug response analysis. The correlation between drug sensitivity and PPARA, PPARD, PPARG, PPARGC1A, and PPARGC1B across TCGA cancers. The scatter plots are ranked by p value.

Drug response analysis. The correlation between drug sensitivity and PPARA, PPARD, PPARG, PPARGC1A, and PPARGC1B across TCGA cancers. The scatter plots are ranked by p value.