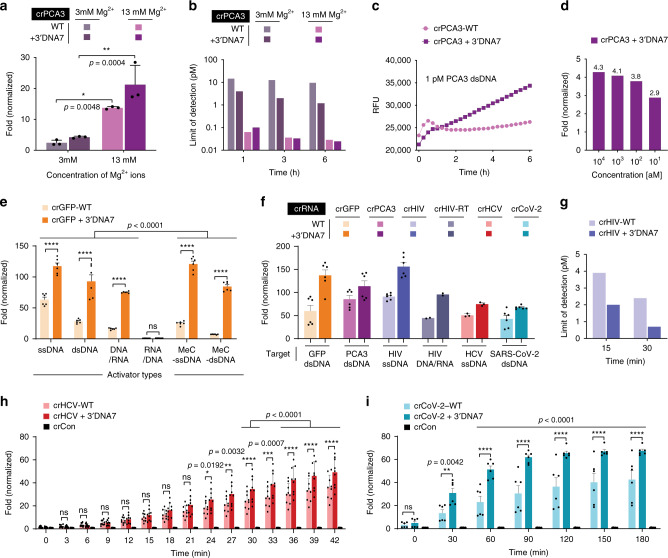
Fig. 5. Improved detection of various targets using the ENHANCE system.
a Effect of Magnesium ion on the trans-cleavage activity. Error bars represent mean ± SD, where n = 3 technical replicates. Statistical analysis was performed using two-way ANOVA test with Sidak’s multiple comparison test, where ns = not significant, and the asterisk (*) denotes p values. b Limit of detection in femtomolar targeting PCA3 in simulated human urine at optimized Mg2+ concentration. c Raw fluorescence data showing detectable signal difference at 1 pM of PCA3 DNA. d Fold change in fluorescence signal of the modified crRNA + 3′DNA7 targeting GFP after the recombinase polymerase amplification (RPA) step. e Effect of heteroduplex DNA-RNA and methylated activators on the trans-cleavage activity of LbCas12a. f trans-cleavage activity of different DNA targets. GFP, PCA3, COVID-19, and HCV are dsDNA activators, and their fluorescence shown were taken after 3 h. The HIV target is ssDNA or cDNA/RNA heteroduplex, and its fluorescence signal shown was taken after 1 h. g Limit of detection targeting HIV cDNA fragment after 15 and 30 min. Results in b and g are based on the limit of detection calculations. h Fold change in trans-cleavage activity with LbCas12a in presence of 100 pM (10 fmols) of target HCV ssDNA. Using modified crRNA, the limit of detection of HCV target ssDNA was found to be 290 fM (29 amoles) at 30 min, without target amplification. i Fold change in trans-cleavage activity with LbCas12a in presence of 100 pM (10 fmols) of target SARS-CoV-2 cDNA (dsDNA). For h, error bars represent mean ± SEM, where n = 9 replicates (three technical replicates examined over three independent experiments). For e, f, and i, error bars represent mean ± SEM, where n = 6 replicates (three technical replicates examined over two independent experiments). For e, h, and i, statistical analysis was performed using a two-way ANOVA test with Dunnett’s multiple comparison test, where ns = not significant with p > 0.05, and the asterisks (*, **, ***, ****) denote significant differences with p values listed above. Source data are available in the Source Data file.

