Figure 3.

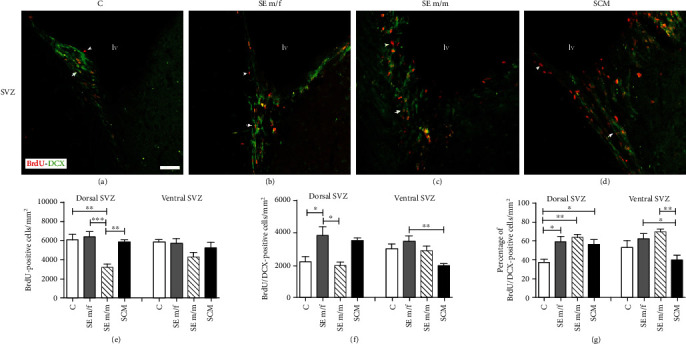
Representative photomicrographs of double immunolabeling for BrdU (red) and DCX (green) in the dorsal SVZ in the control (C; (a)), social exposure to a female (SE m/f; (b)), social exposure to a male (SE m/m; (c)), and social cohabitation with mating (SCM; (d)). White arrows indicate BrdU-positive/DCX-positive cells (organized in chain arrangements), and white arrowheads indicate BrdU-positive/DCX- negative cells. Photomicrographs were taken at 20x. Scale bar: 100 μm. Data analysis of cell proliferation, total BrdU/DCX-positive cells, and percentage of BrdU/DCX-positive cells in the C, SE m/f, SE m/m, and SCM animals are shown in (e–g). lv: lateral ventricle. Data were analyzed by one-way ANOVA followed by Bonferroni's post hoc tests. ∗p < 0.05 and ∗∗p < 0.01. Results of ANOVA analyses are provided in the text. Dorsal SVZ: C (n = 7), SE m/f (n = 7), SE m/m (n = 6), and SCM (n = 6); ventral SVZ: C (n = 5), SE m/f (n = 7), SE m/m (n = 6), and SCM (n = 6).
