
Fig. 3 |. Comparison of cell population clustering methods.
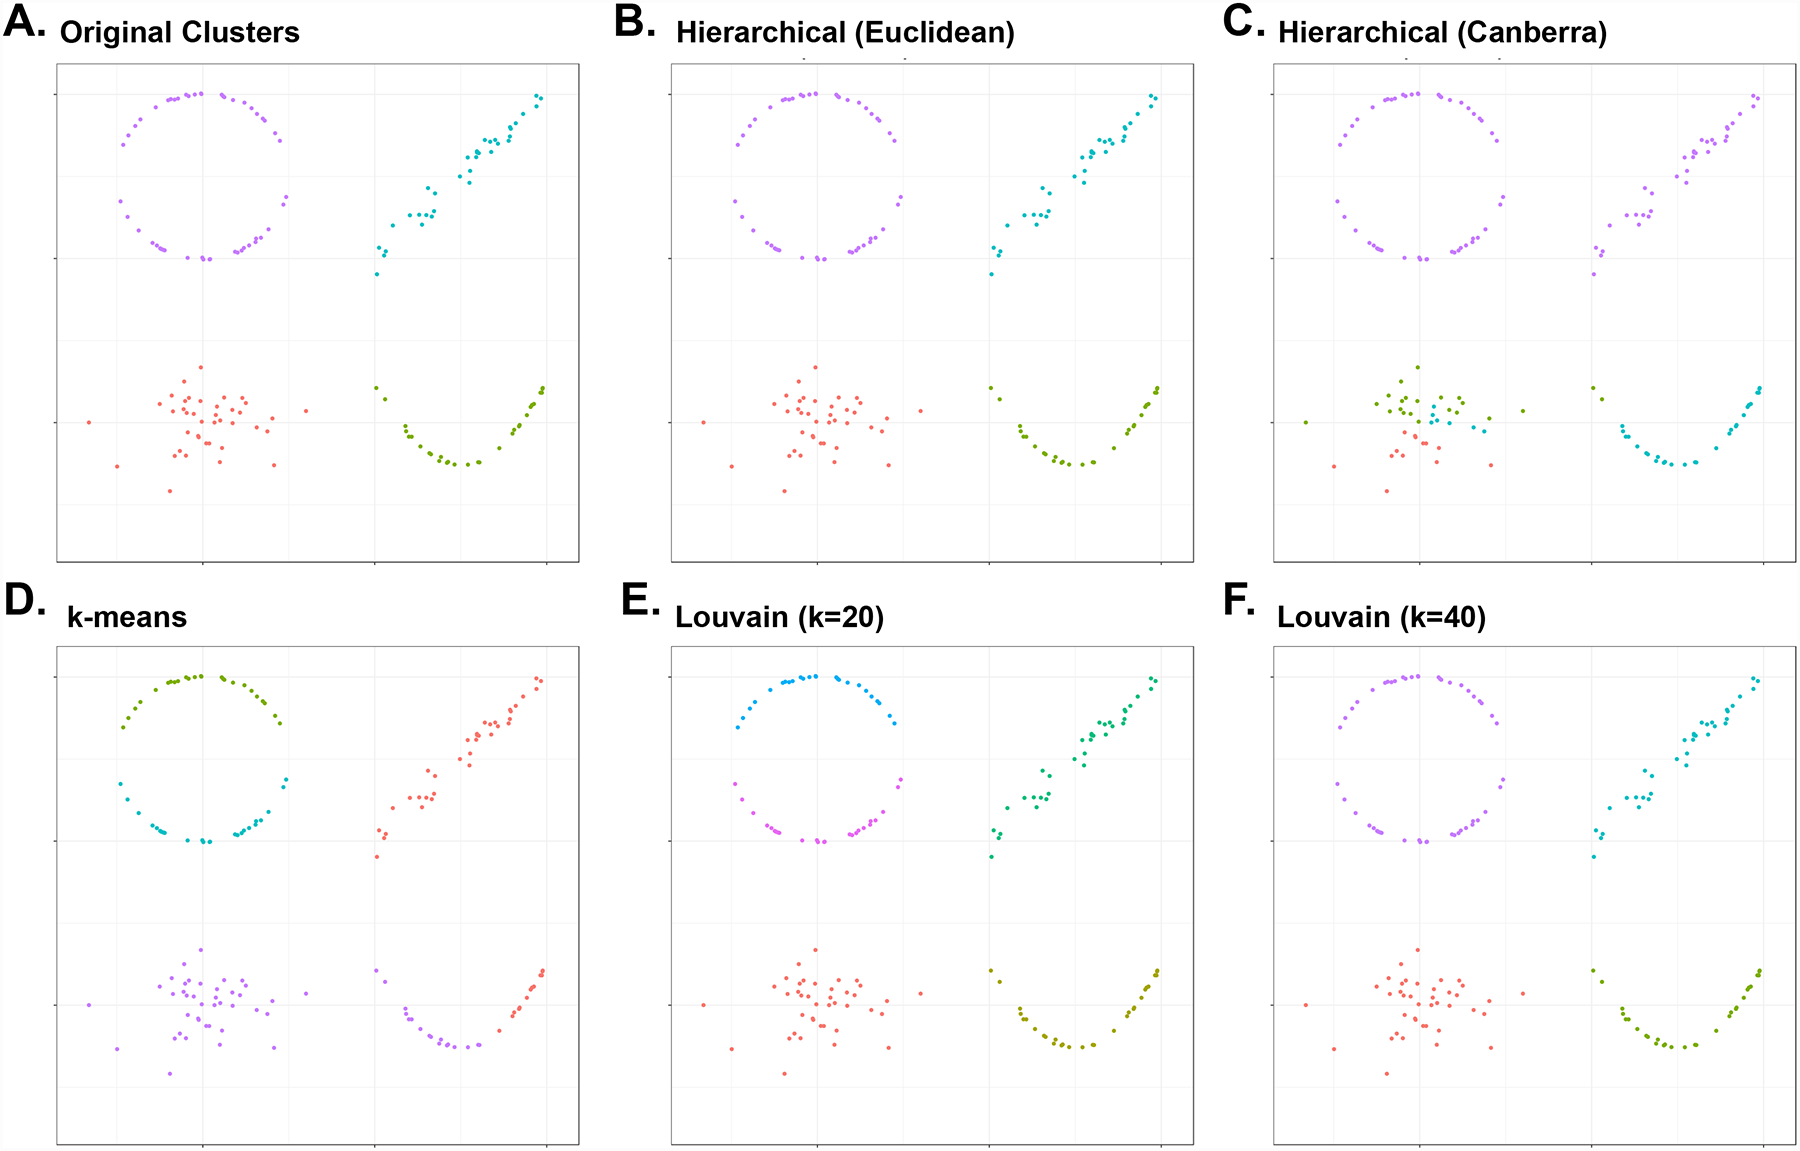
a | Simulated 2D single-cell RNA-sequencing data representing circular (top left), linear (top right), curved (bottom right) and noisy (bottom left) distribution of cells. Colours indicate clusters identified by different clustering methods. Four original clusters are shown. Clusters of the same dataset can change depending on b | hierarchical clustering on Euclidean distance, c | hierarchical clustering on Canberra distance, d | k-means (k = 4), e | Louvain clustering after converting to a 20-nearest neighbour (NN) graph and f | Louvain clustering after converting to a 40-NN graph. In our simulation, hierarchical clustering based on Canberra distance incorrectly subdivided a noisy cluster and merged two distinct clusters. The k-means approach improperly unified the linear trajectory cluster and the ascending part of curve trajectory cluster. The Louvain algorithm incorrectly divided a large cluster into several subclusters when performed with an insufficient number of NNs, whereas the algorithm provided correct clustering when performed with the sufficient number of NNs. Consequently, a universally optimal clustering method for all datasets does not exist, as different types of datasets possess intrinsically unique patterns of cell populations, such as trajectory shape, complexity and noise. Although graph-based algorithms (such as Louvain) show the best performance in general, other clustering methods are still encouraged for comparison. Biological validation must subsequently be performed for verification of the obtained results.