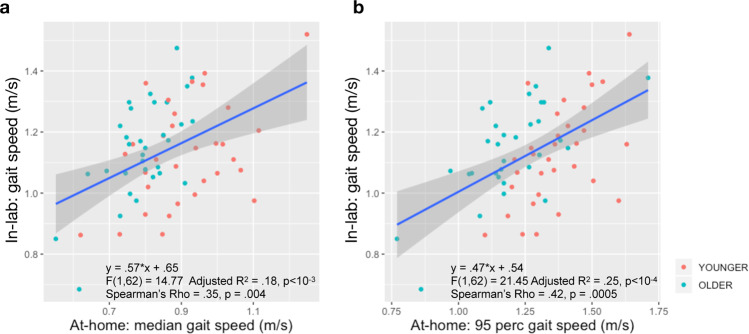
Fig. 4. Weak association between in-lab and at-home gait speed.
a The median gait speed at home showed a significant slope and an intercept (β = 0.57, p < 10−3, I = 0.65; p < 10−5). The two gait speed measures were moderately correlated (Spearman’s rho = 0.35, p = 0.004), and at-home median gait speed explained only 18% of the variance of in-lab gait speed. b When a regression analysis was performed to explain the in-lab gait speed with the 95th percentile gait speed, at-home gait speed showed a significant slope and an intercept (β = 0.47, p < 10−4; I = 0.54, p = 10−4). The two gait speed measures showed moderate correlation (Spearman’s rho = 0.42, p = 0.0005). At-home 95th percentile gait speed explained only 25% of the variance of in-lab gait speed. Shaded area shows the 95% confidence interval.

