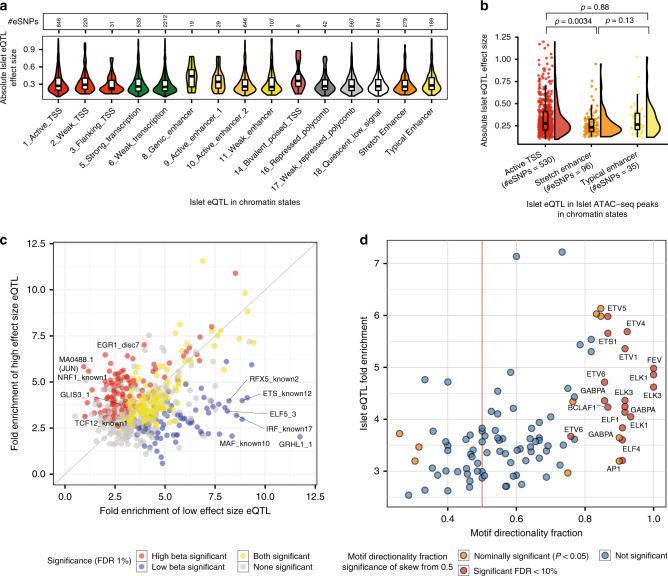
Fig. 2. Integration of islet eQTL with epigenomic information.
a Distribution of absolute effect sizes for islet eQTLs in each islet chromatin state. b Distribution of absolute effect sizes for islet eQTL in ATAC-seq peaks in three islet chromatin states. eQTL SNPs in ATAC-seq peaks in stretch enhancers have significantly lower effect sizes than SNPs in ATAC-seq peaks in active TSS and typical enhancer states. P-values were obtained from a Wilcoxon rank-sum test. c Fold enrichment for transcription factor footprint motifs to overlap low vs high effect size islet eQTL SNPs. d TF footprint motif directionality fraction vs fold enrichment for the TF footprint motif to overlap islet eQTLs. TF footprint motif directionality fraction is calculated as the fraction of eQTL SNPs overlapping a TF footprint motif, where the base preferred in the motif is associated with increased expression of the eQTL eGene. Significance of skew of this fraction from a null expectation of 0.5 was calculated using the binomial test. Source data are provided as a Source data file.

