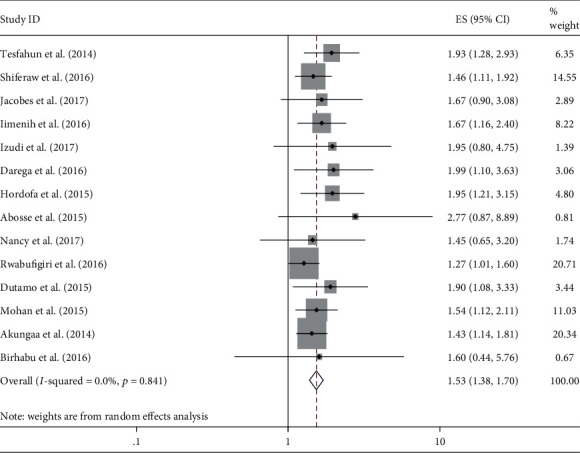
Figure 2.

Forest plot shows the effect of antenatal care use on postnatal care service utilization. The midpoint and the length of each line segment indicate odds ratio and 95% confidence interval, respectively, whereas the diamond shape indicate the overall pooled estimate of odds ratio for the fourteen studies.
