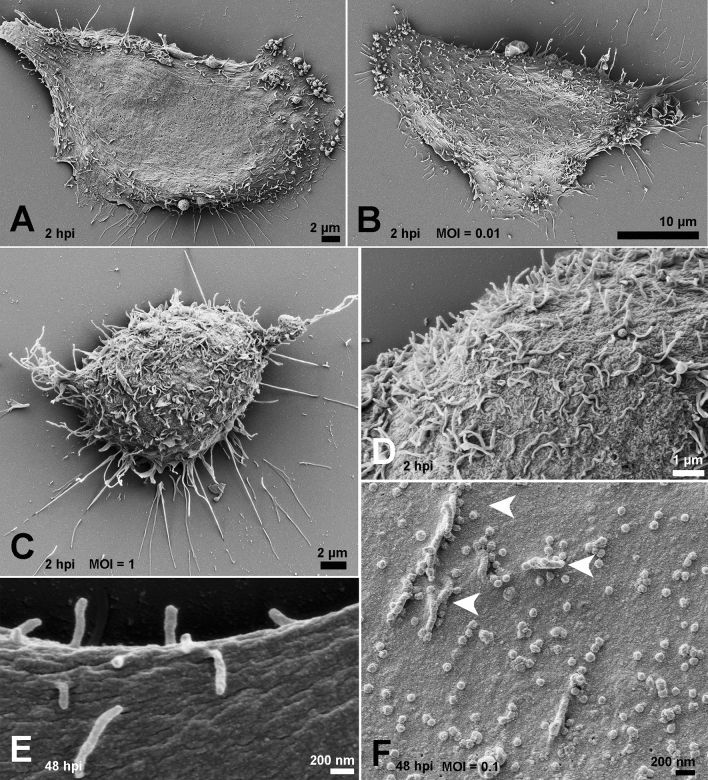
Figure 1.
Effect of SARS-CoV-2 infection on host cell surface at 2 and 48 hpi. At 2hpi, mock-infected cells exhibited smooth surfaces (A), while infected cells presented a discreet increment in the number of SP with the MOIs of 0.01 (B) and 1 (C). No viral particles were observed on the surface of infected cells at 2hpi, even with the MOI of 1 (D). (E) Mock-infected cell surface at 48 h. (F) Virus adhesion to the cell surface and SP (arrowheads) became more evident with the MOI of 0.1 (F). Bars: (A, C) 2 µm; (B) 10 µm; (D) 1 µm; (E, F) 200 nm.

