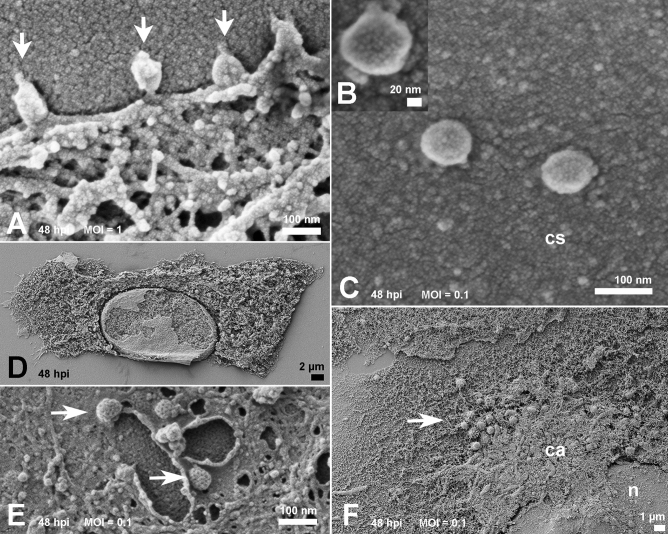
Figure 2.
Morphology of cells surface and interior at 48 hpi. (A) With the MOI of 1, virus attachment (arrows) was frequent. (B) Spikes of SARS-CoV-2 particles observed on the cell surface were discernible (MOI of 0.1). Viruses observed on cell surface (cs) exhibited a size between 70 and 85 nm (B, C) at MOIs of 0.01 and 0.1 respectively. Scraping of cells plasma membrane (D) revealed a homogeneous distribution of organelles in mock-infected samples, Infected cells exhibited coated pits vesicles of ≃ 100 nm (arrows) at perinuclear sites (E). A polarized disposal at the infected cells cytosol (F) represented as a condensed area (ca) in the infected ones (MOI of 0.1). (n): nucleus; Bars: (A, C, E) 100 nm; (B) 20 nm; (D) 2 µm; (F) 1 µm.

