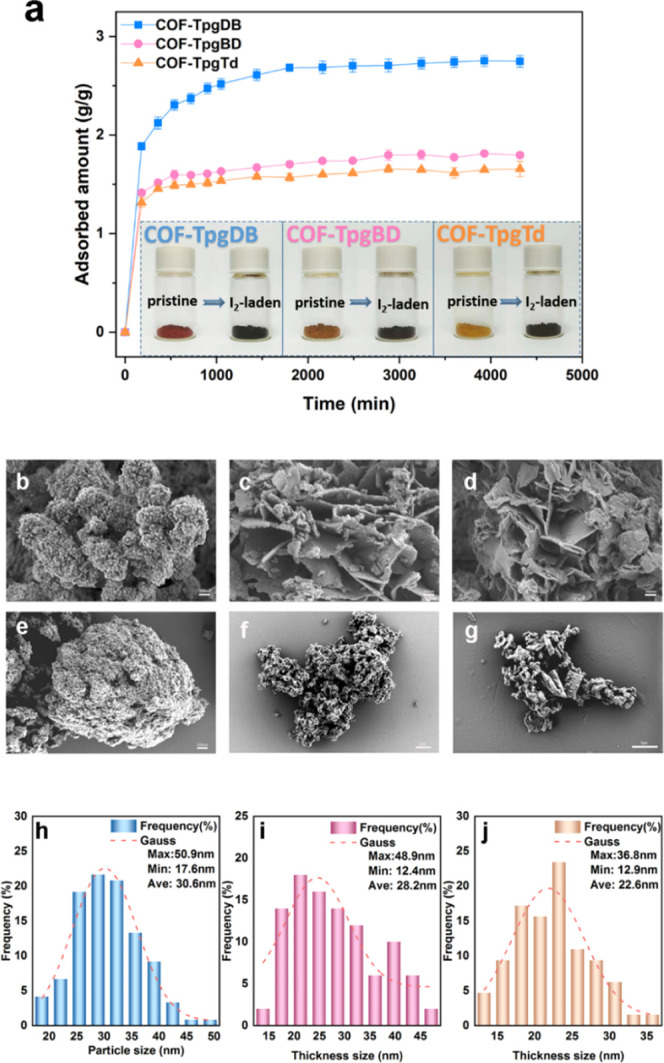
Figure 2.

Analysis of iodine adsorption of CCOFs. (a) Adsorption isotherm of iodine versus contact time at 398 K, 1 bar; inset shows photographs before and after iodine adsorption. (b–d) SEM images of pristine COF-TpgDB, COF-TpgBD, and COF-TpgTd. (e–g) SEM images of I2-laden COF-TpgDB, I2-laden COF-TpgBD, I2-laden COF-TpgTd. (h) Particle size distribution of COF-TpgDB, (i) thickness size distribution of COF-TpgBD, and (j) thickness size distribution of COF-TpgTd.
