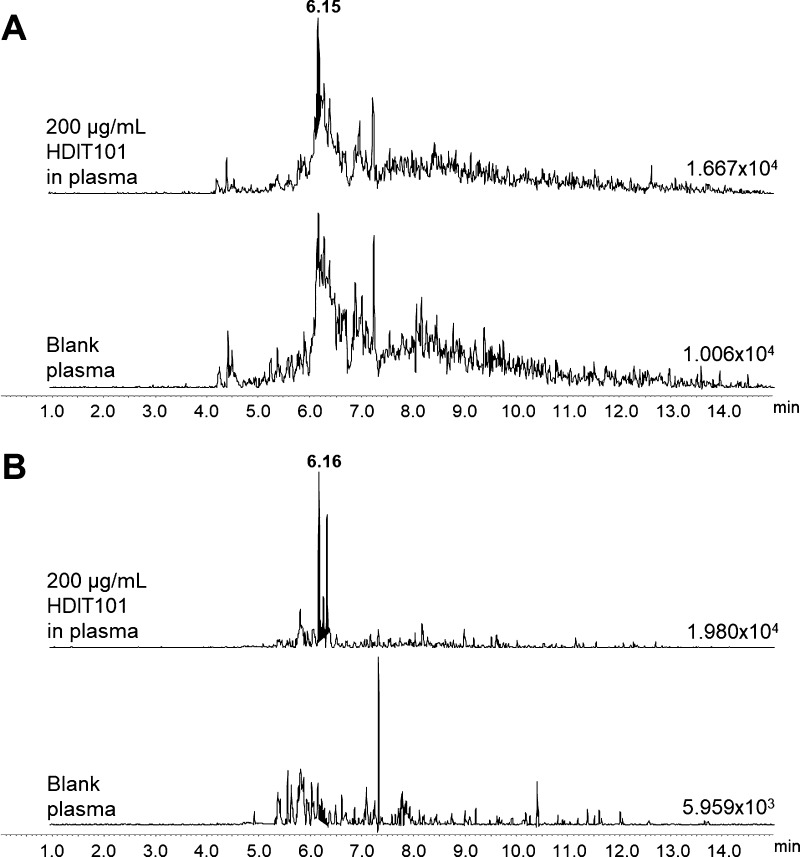
Figure 3.
MRM traces of transition m/z 1027 > m/z 780 for the HC3 peptide after complete sample processing of blank plasma and plasma spiked with 200 μg/mL HDIT101 (A). MRM traces of transition m/z 896 > m/z 982 for the LC1 peptide after complete sample processing of blank plasma and plasma spiked with 200 μg/mL HDIT101 (B). Absolute intensities of the most intense peak of each MRM trace are indicated on the baseline of each trace. Retention time of the targeted compounds is given in bold character on the top trace.

