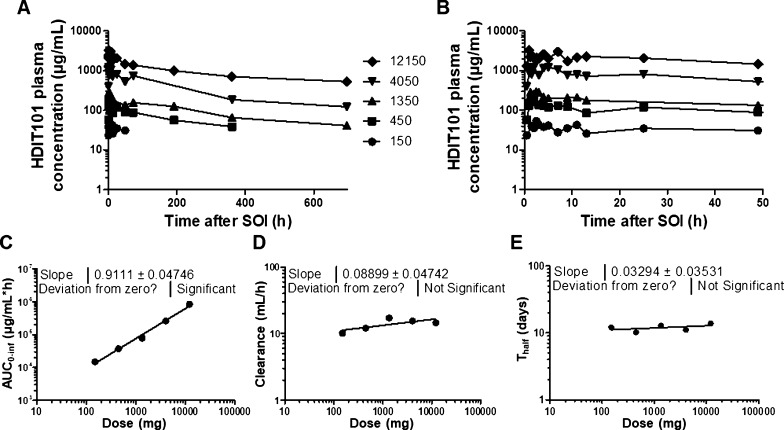
Figure 7.
PK profiles over 29 days after SOI of the five healthy volunteers dosed with 150, 450, 1350, 4050, and 12,150 mg, respectively, (A) and zoomed view on the first 48 h (B). Dose correlations with total area under the curve (AUC0–inf) (C), clearance (D), and half-life (Thalf), (E) showing dose linearity for the AUC0–inf, a stable clearance, and Thalf independent from dose.

