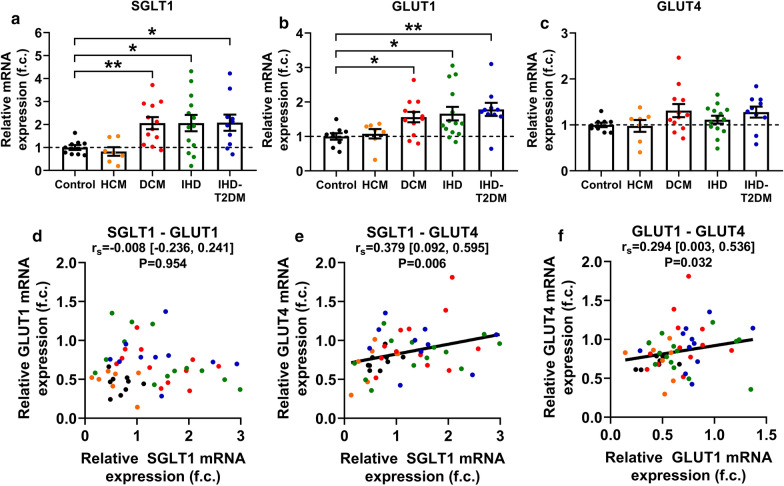
Fig. 1.
Myocardial left ventricular expression of the three major glucose transporters and their correlations. a Quantification of left ventricular (LV) relative mRNA expression of sodium-glucose cotransporter 1 (SGLT1) in controls and in patients with heart failure (HF). b Quantification of LV relative mRNA expression of facilitative glucose transporter 1 (GLUT1) in controls and in patients with HF. c Quantification of LV relative mRNA expression of GLUT4 in controls and in patients with HF. d Correlation between the LV relative mRNA expressions of SGLT1 and GLUT1. e Correlation between the LV relative mRNA expressions of SGLT1 and GLUT4. f Correlation between the LV relative mRNA expressions of GLUT1 and GLUT4. For easier interpretation, expression values are normalized to that of Controls (i.e. mean of Control group = 1.00). To compare means of five groups, one-way analysis of variance (ANOVA) was performed with Welch’s correction followed by Dunnett T3 post hoc test to compute intergroup differences relative to the Control group. Statistical significance according to the post hoc test (relative to Control) is highlighted as follows: *P < 0.05, **P < 0.01. For zero-order correlation analysis, Spearman’s rho (rs) was computed. For all correlation coefficients, bias-corrected and accelerated (BCa) 95% confidence intervals (CI) are reported based on n = 1000 bootstrap samples. DCM dilated cardiomyopathy, f. c. fold change, GLUT1 and 4 facilitative glucose transporter 1 and 4, HCM hypertrophic cardiomyopathy, IHD ischemic heart disease, IHD-T2DM IHD and type 2 diabetes mellitus, rs Spearman’s rho (correlation coefficient), SGLT1 sodium-glucose cotransporter 1

