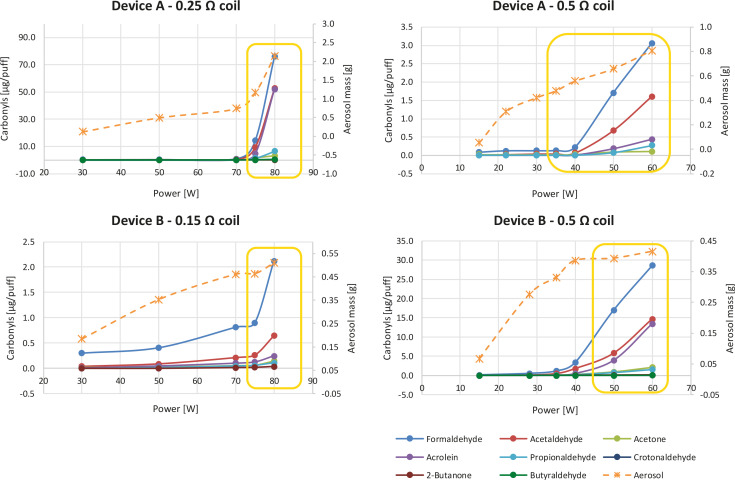
Figure 1.
Generation of carbonyl emissions (expressed per puff) by device A and device B equipped with the dedicated coils (heading of each graph) and amount of aerosol collected per one puff session (20 puffs for device A; 10 puffs for device B). Yellow frames indicate the power setting above the recommended power range of the coils

