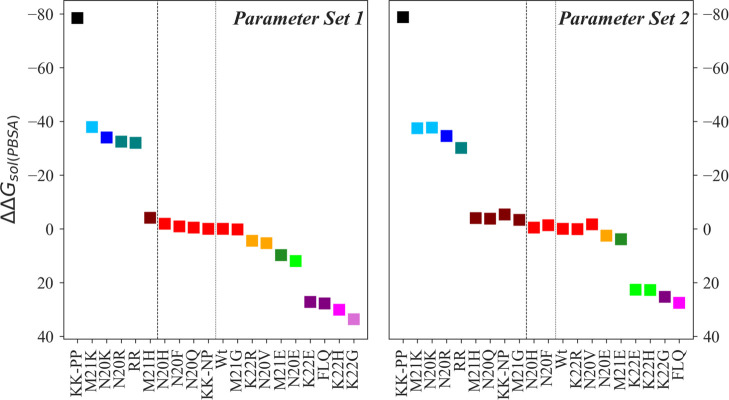
Figure 3.
Effect of mutation on the solubility of nisin estimated using PBSA. The figure shows the difference between the solvation free energies of mutant and wild-type nisin (ΔΔGsol = ΔGmutant – ΔGWt). Nisin and mutants are ranked in decreasing order of solubility. A different color is used for each rank, and a matching color is assigned to the mutants with the same rank. Statistical significance is determined by using multiple comparison Tukey’s test at α = 0.05. The left figure shows data derived in simulations relying on the parameter set of de Miguel et al.(11) (parameter set 1, left sub-figure), and the right one such derived from simulations using Turpin et al.(10) parameters (parameter set 2, right subfigure).

