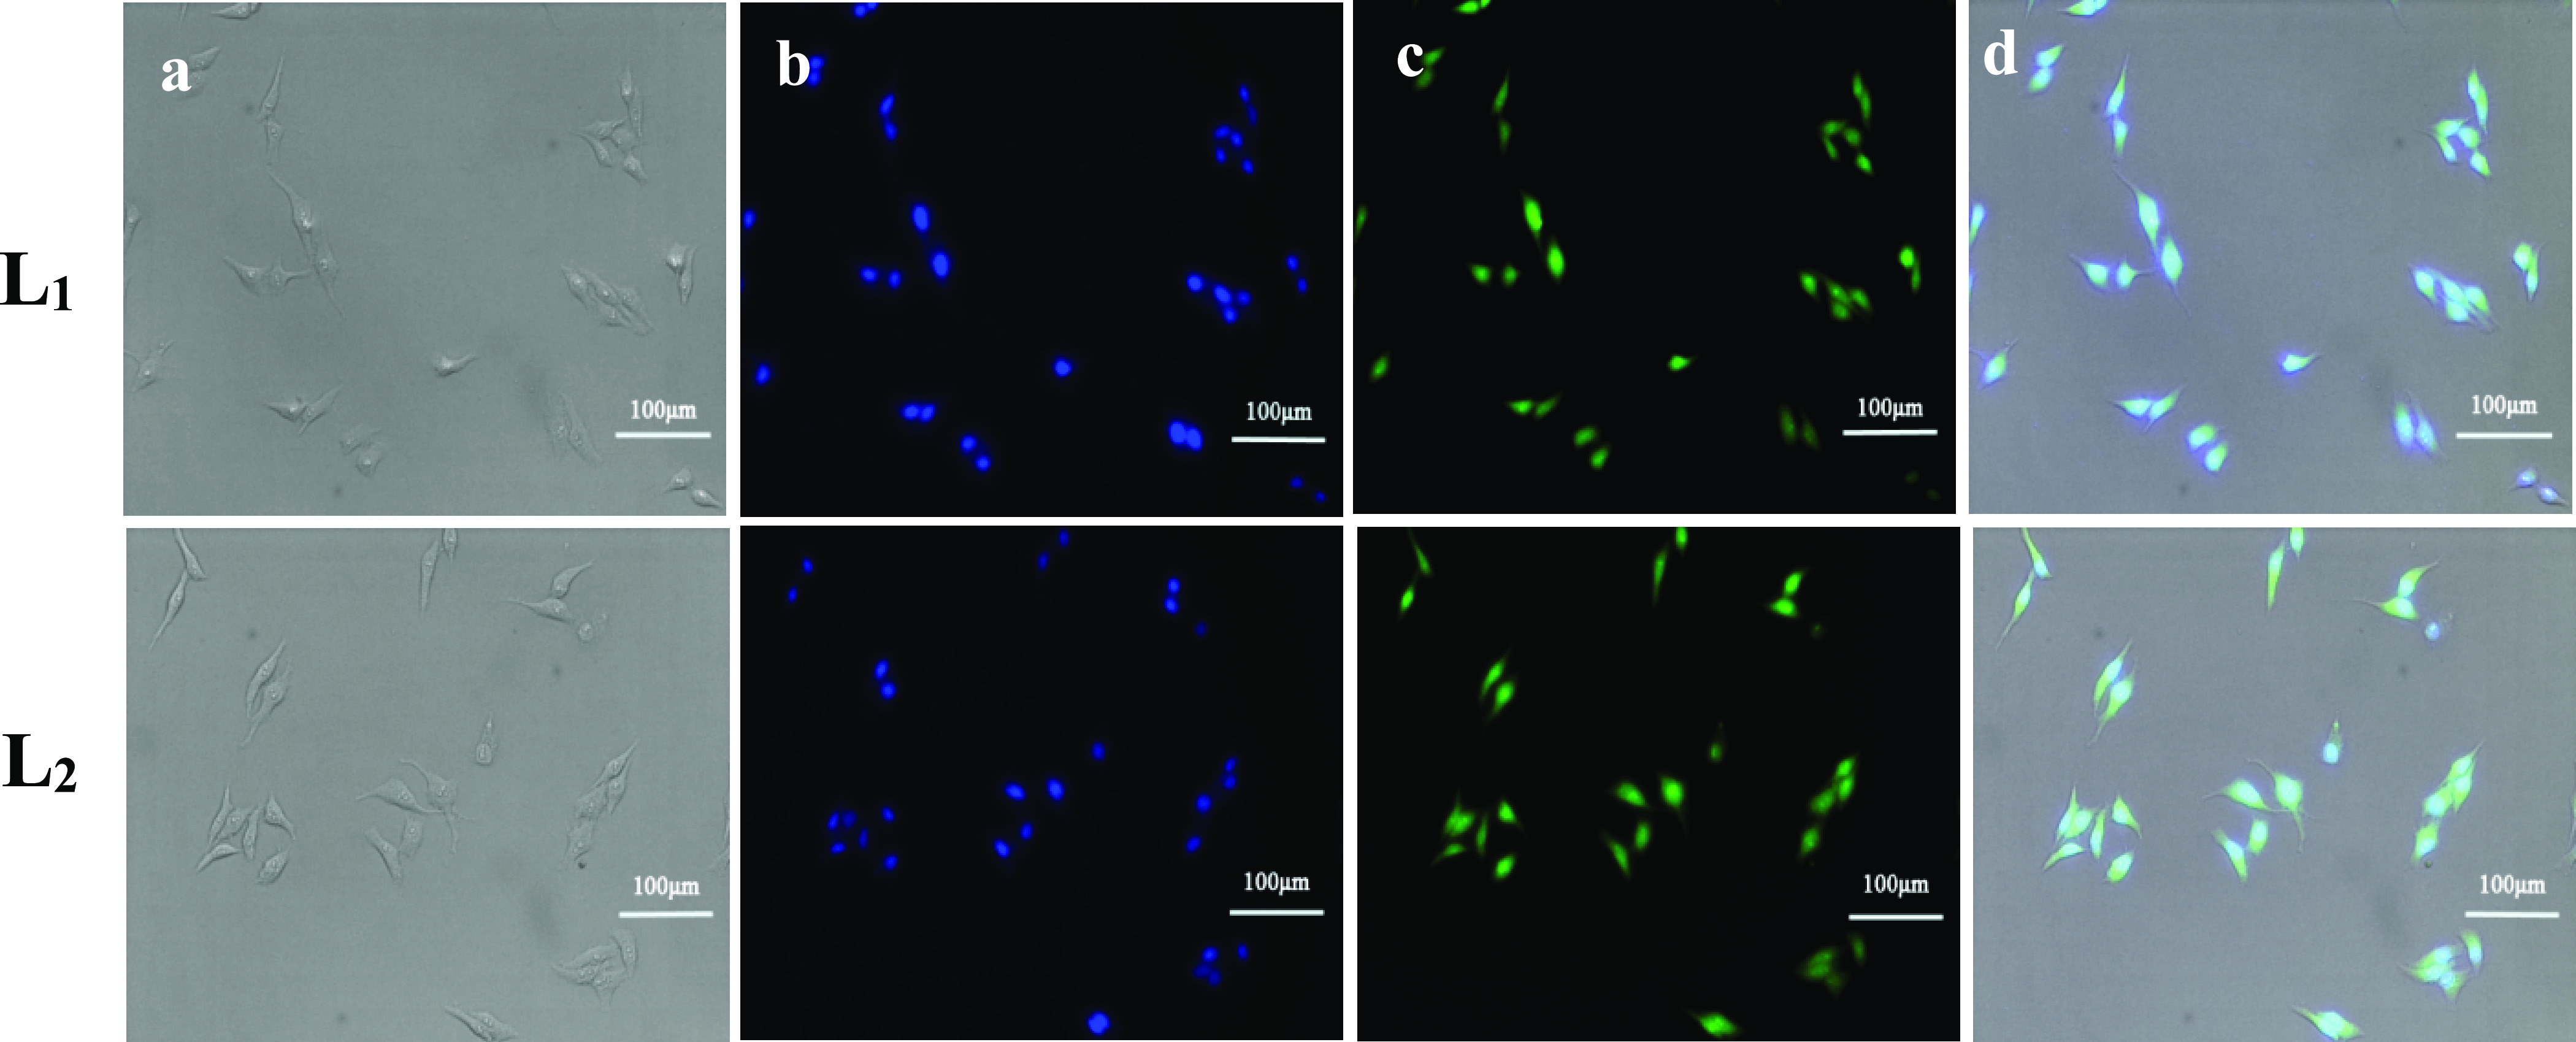
Figure 6.

Inverted fluorescence imaging of HepG2 cells with 20× objectives. (a) Bright-field image of HepG2 cells, (b) HepG2 cells stained with DAPI, (c) HepG2 cells stained with the Schiff bases, and (d) the overlay image.

Inverted fluorescence imaging of HepG2 cells with 20× objectives. (a) Bright-field image of HepG2 cells, (b) HepG2 cells stained with DAPI, (c) HepG2 cells stained with the Schiff bases, and (d) the overlay image.